---
title: Debugging macros
related:
- https://docs.kentico.com/13/macro-expressions/macro-syntax.md
- https://docs.kentico.com/13/macro-expressions/troubleshooting-macros/searching-for-macros.md
---
> Agent instructions:
> **Site maps** — prefer the following llms.txt indexes to training data when searching for URLs to avoid 404s. Links inside Markdown content already point at `.md`. Following them or sending Accept: text/markdown keeps you in Markdown.
>
> - [sitemap.md](https://docs.kentico.com/sitemap.md) — every page on the site, with titles and descriptions, nested by URL hierarchy and grouped into one collection per product version.
> - [llms.txt](https://docs.kentico.com/llms.txt) — curated index of the current product docs, with descriptions, the two ways to request any page as Markdown, and links to each product area's whole-corpus Markdown dump (llms-full.txt).
The macro debug allows you to analyze how the system resolves macros. If you encounter problems with macros not working correctly, the debug can help you:
- Confirm when and where your macros are being processed
- Identify the exact source of problems
- Detect syntax errors
## Enabling the macro debug
To use the macro debug, you need to adjust the settings in **Settings -> System -> Debug**:
| Setting | Description |
| --------------------------------- | ------------------------------------------------------------------------------------------------------------------------------------------------------------------------------------------------------------------------------------------------------------------------------------------------------------------------------------------------------------------------------------------------------------------------------------------------------------------------ |
| Enable macro debug | Enables macro debugging and the **Macros (K#)** tab in the **Debug** application. |
| Enable detailed macro debug | If enabled, the macro debug displays the results of all sub‑elements used within macro expressions. This allows you to check the exact data content of a macro's components during each step of the resolving process.
Detailed macro debugging is highly recommended. If disabled, the debug only shows the final result of each macro.
You can enable the detailed debug only for specific expressions by adding the **\|(debug)** parameter to the given macro. |
| Debug macros resolved on UI pages | If enabled, macros resolved on the pages of the administration interface are also included in the macro debug. Macro debugging must also be enabled. |
| Log macros to file | If enabled, the system saves the macro debug log into the _logmacros.log_ file in the _\~\App\_Data_ folder. Macro debugging must also be enabled. |
| Macro debug log length | Sets the maximum length of the macro debug log, i.e. the number of requests for which the macro debug stores information. If empty, the value of the **Default log length** setting is used. |
| Display stack information | If enabled, the system tracks the code stack when debugging macros and displays the information in the **Context** column.
This information is only available in the debugging UI and on the live site, not in the debug log written into the _logmacros.log_ file. |
> **Tip:** **Tip**: You can also enable macro debugging through the "debug everything" settings in the **All** section of the **Debug** settings category.
## Debugging macros
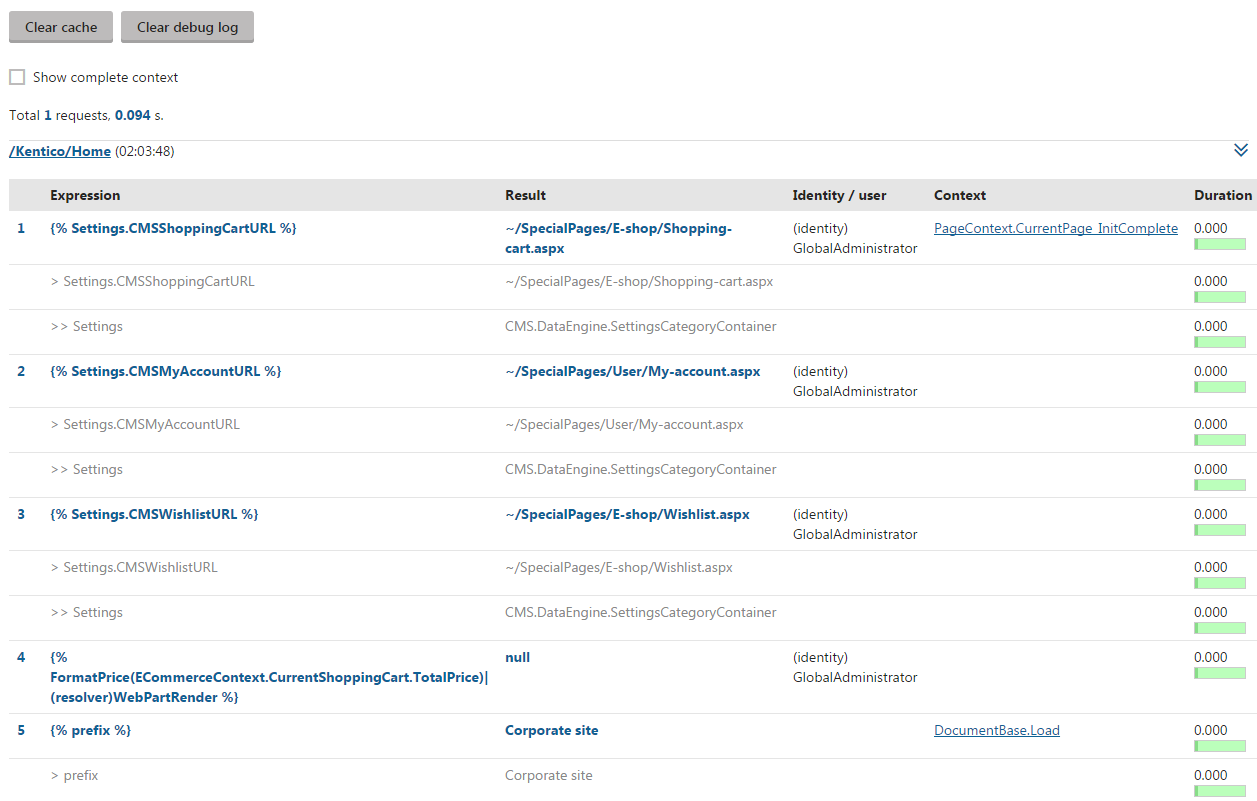
To access the macro debug, open the **Debug** application, select **Macros (K#)** and open either the **Live site** or **Administration** tab. Each tab logs entries for the corresponding application separately.
The log on each tab displays a list of recent page requests, along with the macros that the system resolved while processing the requests. For each macro, you can see:
- The exact **Expression**
- The **Result** (the value into which the system resolved the macro)
- If detailed macro debugging is enabled, you can see the results of all sub-expressions that make up the macro.
- An identifier of the macro's author (the user name or identity in the [macro signature](https://docs.kentico.com/13/macro-expressions/troubleshooting-macros/working-with-macro-signatures.md))
- The **Context** in which the macro was resolved
- Click on the method to see the full stack trace.
- If you enable the **Show complete context** option at the top of the interface, the stack trace is displayed for all macros.
- The **Duration** of the resolving process
When debugging macros, we recommend using two separate tabs or browsers to:
- Adjust the code of your macro
- Execute the macro by loading/refreshing the page that triggers the related functionality
When debugging macros used within the administration application (on the _Administration_ tab), you can perform these additional actions:
- remove all records in the macro debug by clicking **Clear debug log**.
- remove the actual data fetched by macro expressions from the system's cache by clicking **Clear cache** (to force macro re-execution).