
Monitoring using the Performance monitor
Kentico EMS required
Features described on this page require the Kentico EMS license.
When you have registered the performance counters for your instance of Kentico in Windows and you have enabled Health monitoring settings in the Kentico administration interface, you can start monitoring values written to the counters. You can use several applications for this purpose, but this page describes how to use the Performance monitor, which is a native part of Windows.
To monitor values of Kentico counters using the Performance monitor:
Type perfmon in Windows Start menu search box and press Enter.
- The system launches the Performance monitor.
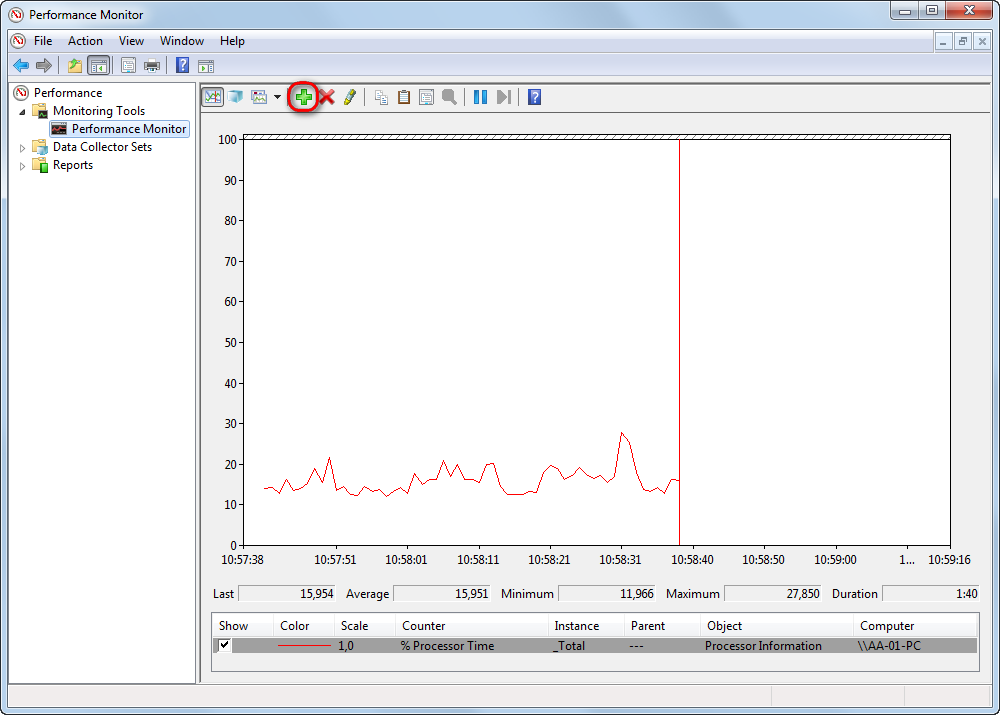
Select Monitoring Tools -> Performance monitor in the navigation tree.
- As you can see, only the default % Processor Time counter is monitored initially.
Click the Add.
From the Select counters from computer list, choose <Local computer>.
- In the section below, you will see a list of all counter categories currently registered in Windows.
Select the Kentico - General (<IIS path>/<IIS website>).
Click Add >>.
Select Kentico - Sites (<IIS path>/<IIS website>).
Click Add >>.
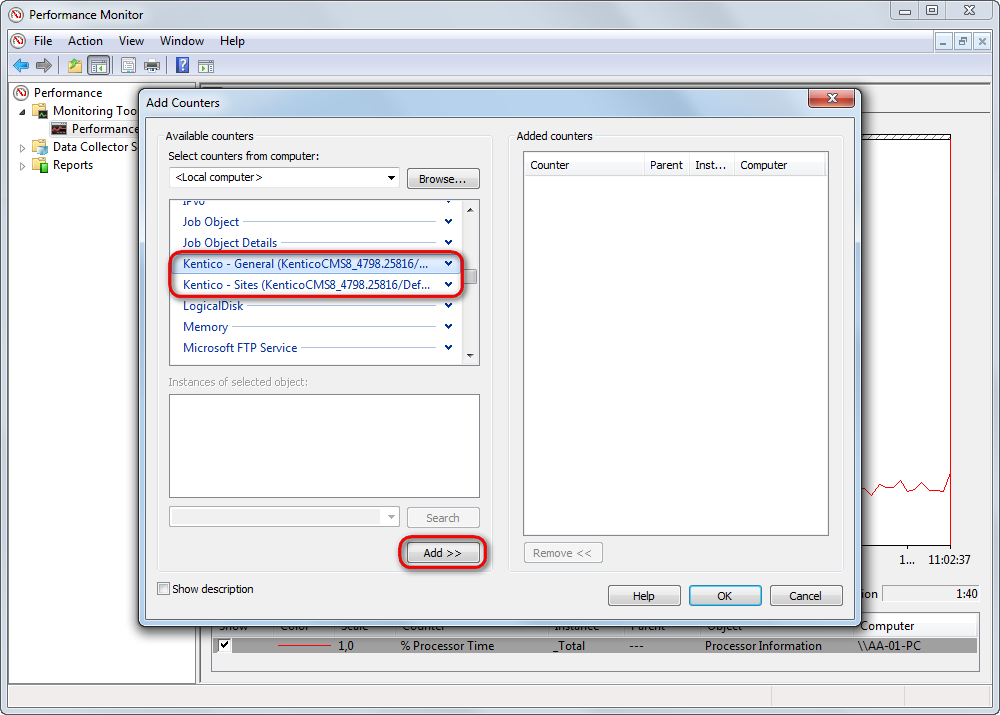
- Added counters will be added to the Added counters list on the right.
Click OK.
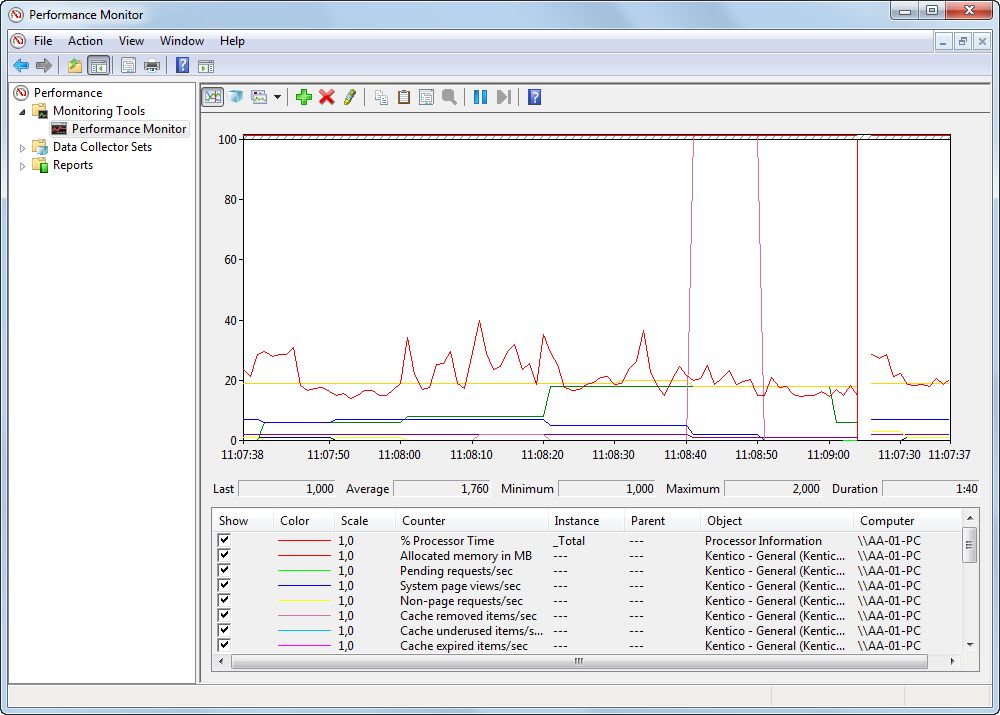
Back in the monitoring UI you can now see that the Performance monitor displays the values in counters in the graph. The values reflect the real activity of the Kentico instance. You can switch between different ways how monitored values are displayed using the Graph type drop-down list.
Clearing counter values
- Log in to the Kentico administration interface.
- Open the System application.
- On the General tab, click Clear performance counters.
This action clears values stored in all counters registered for the current Kentico instance.