Viewing the email feed statistics
The report insights available for tracked newsletters and email campaigns display an overview of the number of contacts who opened, clicked at least one link, or unsubscribed from emails within an email feed in a single dynamic graph.
To view the report insights for individual email feeds:
- Open the Email marketing application on the Email feeds tab.
- Edit() an email campaign or a newsletter containing sent emails.
- Switch to the Report tab.
The Report tab displays the Email feed statistics graph containing all sent marketing emails belonging to the current Email feed.
Reading the Email feed statistics graph
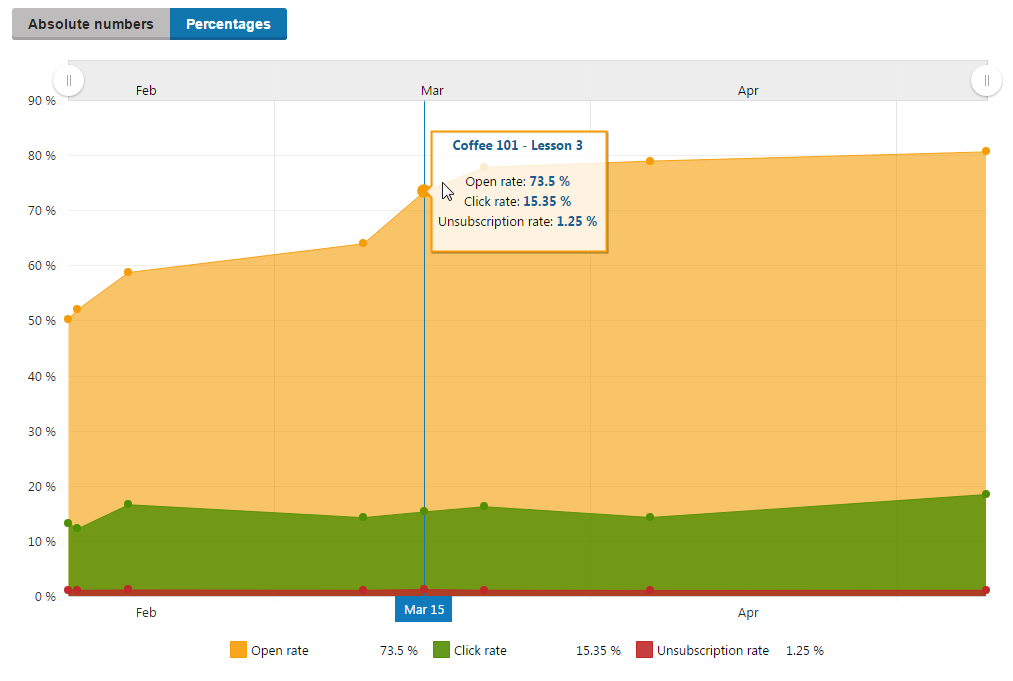
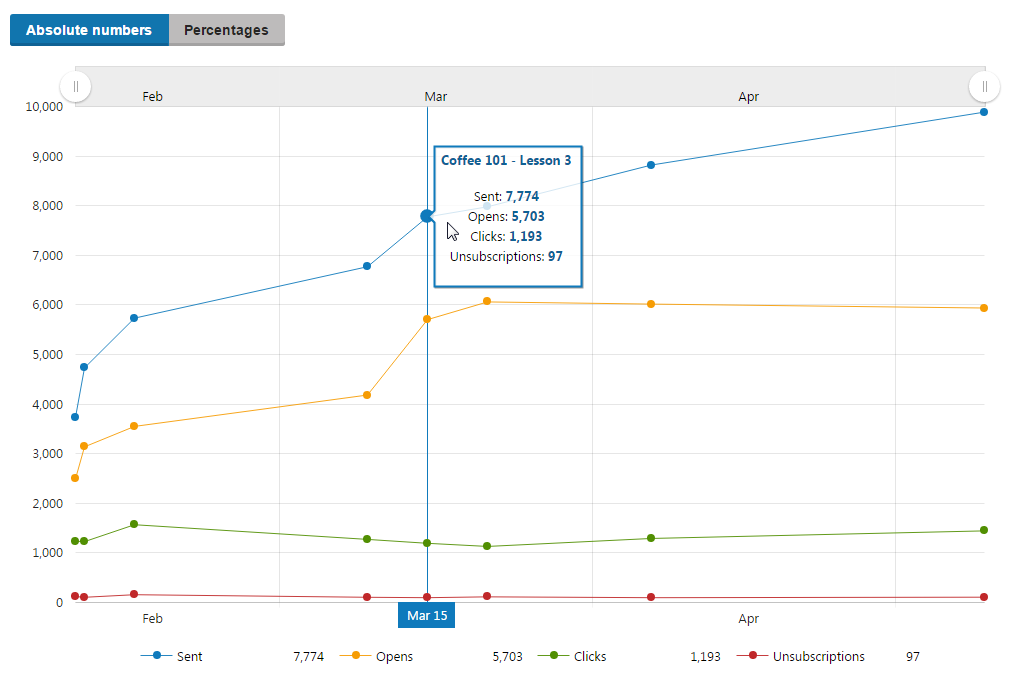
The Email feed statistics graph allows you to switch between the Absolute numbers and Percentages views. You can also use the slider in the graph’s header to focus on a desired time period.
The Absolute numbers view displays the number of sent copies, opens, clicks, and unsubscriptions tracked for each email.
The Percentages view displays the number of opens, clicks, and unsubscriptions for each email as a percentage of total sent copies. For example, if an email was delivered to 100 recipents, but only 50 recipients opened it, the Percentagesview would show 50% open rate for that particular email.