
Debugging SQL queries with Glimpse on MVC sites
During the development of your MVC application you may want to see which SQL queries are run on page load. To debug the executed SQL queries you can use the Kentico.Glimpse integration package.
Setting up Glimpse in MVC application
To use Glimpse in your MVC application, you need to install the related NuGet packages and turn Glimpse on:
- Install the required NuGet integration packages:
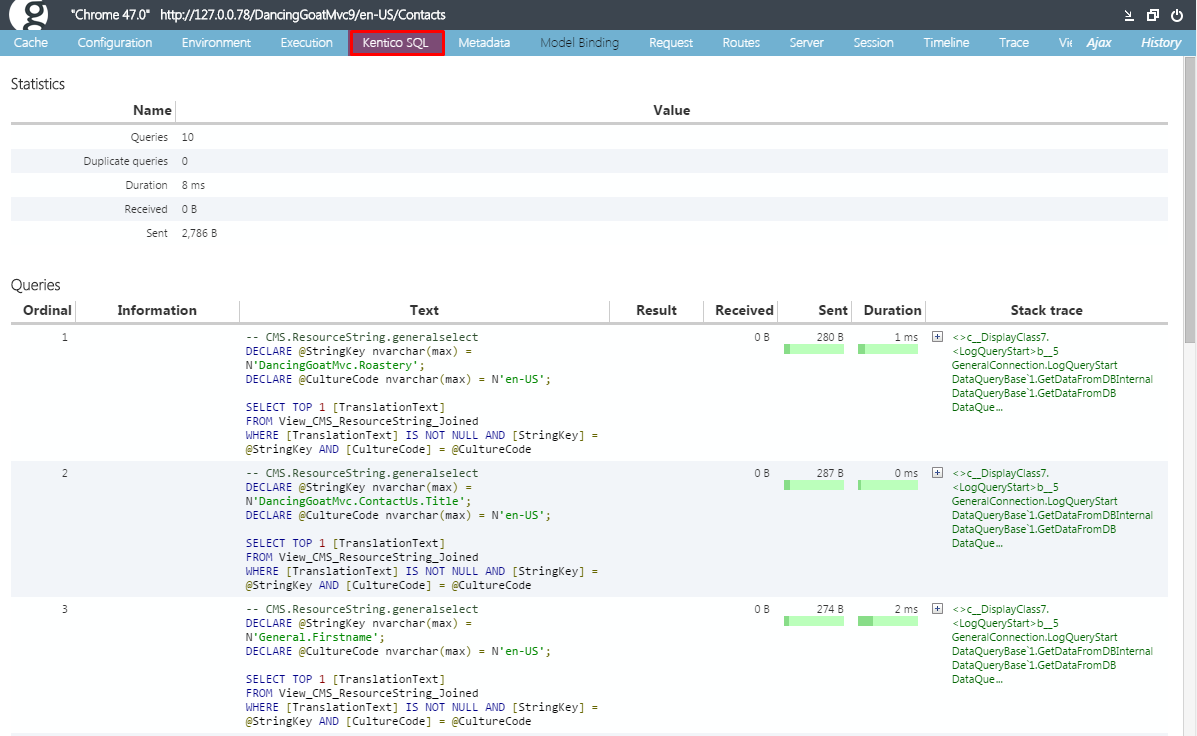
- Kentico.Glimpse - adds the Kentico SQL tab, which provides insight into the SQL operations that the related Kentico instance is performing.
- Glimpse.Mvc5 - adds the following tabs, which provide diagnostics specific to ASP.NET MVC framework:
- Execution
- Model Binding
- Metadata
- Views
- Run the MVC application and navigate to /glimpse.axd.
- Click Turn Glimpse On.
The Glimpse extension is now enabled and you can use its web diagnostics features.
By default, the Kentico SQL tab in Glimpse does not show any information. You need to enable SQL debugging in the Kentico settings to populate the tab:
- Open the Kentico Settings application.
- Navigate to System -> Debug.
- In the SQL queries section, select the Enable SQL query debug option.
At this point the Kentico SQL tab in Glimpse shows the information about executed SQL queries. You can find the following information for each query:
- SQL code of the query.
- Size of the data that was Sent and Received.
- The Duration of the query execution.
- The full Stack trace of each query.
Note: SQL queries executed by the MVC application are not logged in the Debug of the Kentico application.