
Understand Xperience email stats to spot what’s working
When you send an email, your job isn’t finished once you click the Send button. Every message is a chance to build trust. Your contacts permitted you to reach their inbox, and treating their trust with respect is essential.
Email statistics help you see how your message performed: how many people received it, who opened it, and whether they clicked any links. You will see what’s working and what’s not, and improve your future messages.
Xperience collects statistics only for emails sent through a configured email channel. Draft emails aren’t tracked. That means you’ll see real data only after you publish and send an email to actual recipients.
Not seeing any stats? Here’s what to check:
- Ask your administrator to confirm that the email channel is correctly configured.
- Make sure the email sender address is valid and approved for sending.
- Check that your recipient list includes real contacts – not test addresses or users who have opted out of communication.
Remember: Email stats only appear when messages are sent to trackable contacts through a working email channel.
Analyze email performance in Xperience
Xperience provides a few places where you can check how your emails performed. These views help you understand delivery rates in statistics, your contact’s engagement through contact activities, and trends over time.
View stats for individual emails in the admin interface
To see statistics for a specific email, open the email channel you sent it from in the Xperience administration. Email channel is the technical foundation for sending emails. Depending on how your team sets them up, the channels will have business-friendly names. For example, the Kbank demo site has one Marketing Emails channel.
The number of available channels can also vary based on your project’s license.
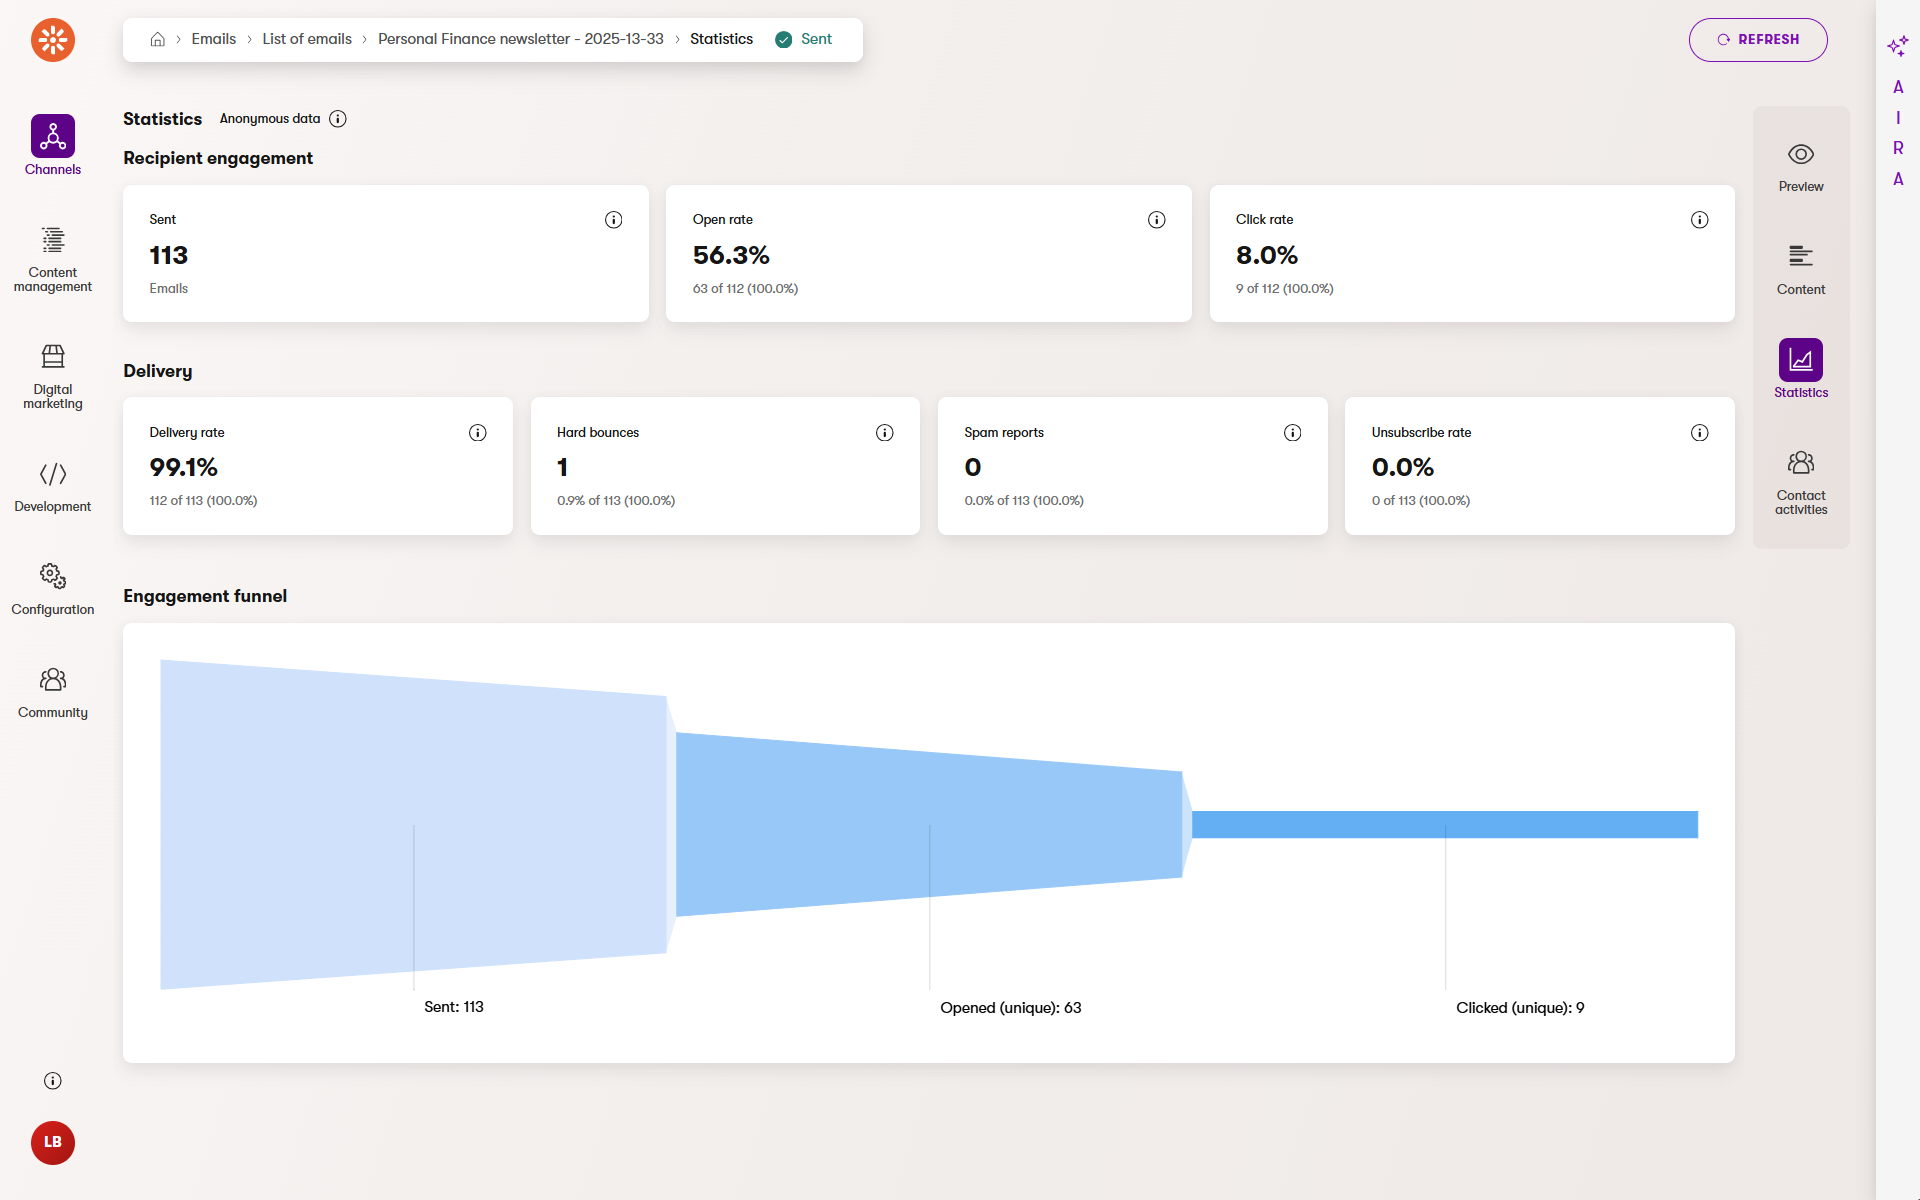
Choose your email and switch to the Statistics tab. You’ll find the most important metrics here, such as how many emails were sent, how many were opened, the overall delivery rate, how many clicks each email generated, and more.
Monitor overall email health in the Xperience Portal
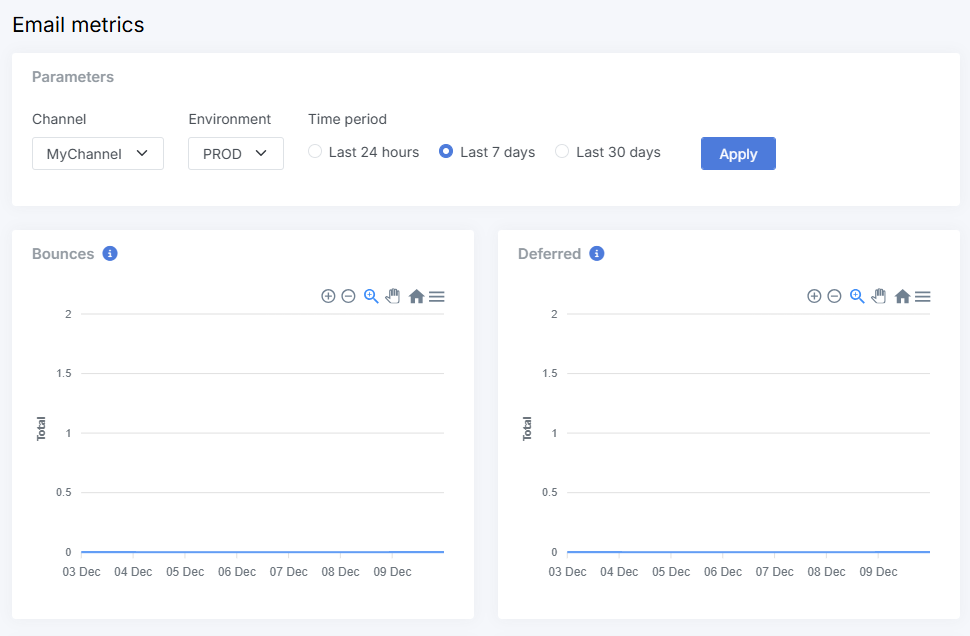
If you’re working on a SaaS project, you can also view email performance in the Email metrics application under the Monitoring section in the Xperience Portal. This view shows statistics collected directly from the SendGrid platform, which is Xperience’s built-in email delivery provider for SaaS.
Who can access the Email metrics app?
Access to the Email metrics application in the Portal is separate from access to the email channel in the Xperience administration. Usually, only users with access to the Xperience Portal, such as administrators, can view these SaaS-level statistics. If you don’t have access, ask your project admin to check your permissions.
You’ll see total counts for delivered, bounced, and deferred emails, along with the number of unique clicks. These metrics help you spot potential deliverability issues, understand how recipients interact with your emails, and find opportunities to improve campaign performance.
Comparing email performance?
Use the Statistics tab to review the results of individual emails, then check the Email metrics app in the Portal to spot delivery patterns and engagement trends across multiple sends.
Can’t find stats for an email? Double-check that:
- The email was sent through a configured email channel.
- You’re looking at the correct project environment in SaaS (usually called production).
- The email isn’t in Draft state or wasn’t sent as a test message.
Understand the key email metrics
Email statistics in Xperience show a few core metrics that help you quickly assess whether your message reached people and how they reacted. Xperience calculates them based on real-world email behaviors, but it helps to understand what’s tracked, and how.
Sent emails
This shows how many times your email was sent to contacts. It confirms that the email left the Xperience’s Email queueand was handed off to a delivery service, like an SMTP server or SendGrid. It doesn’t mean the message was delivered, it could still bounce later.
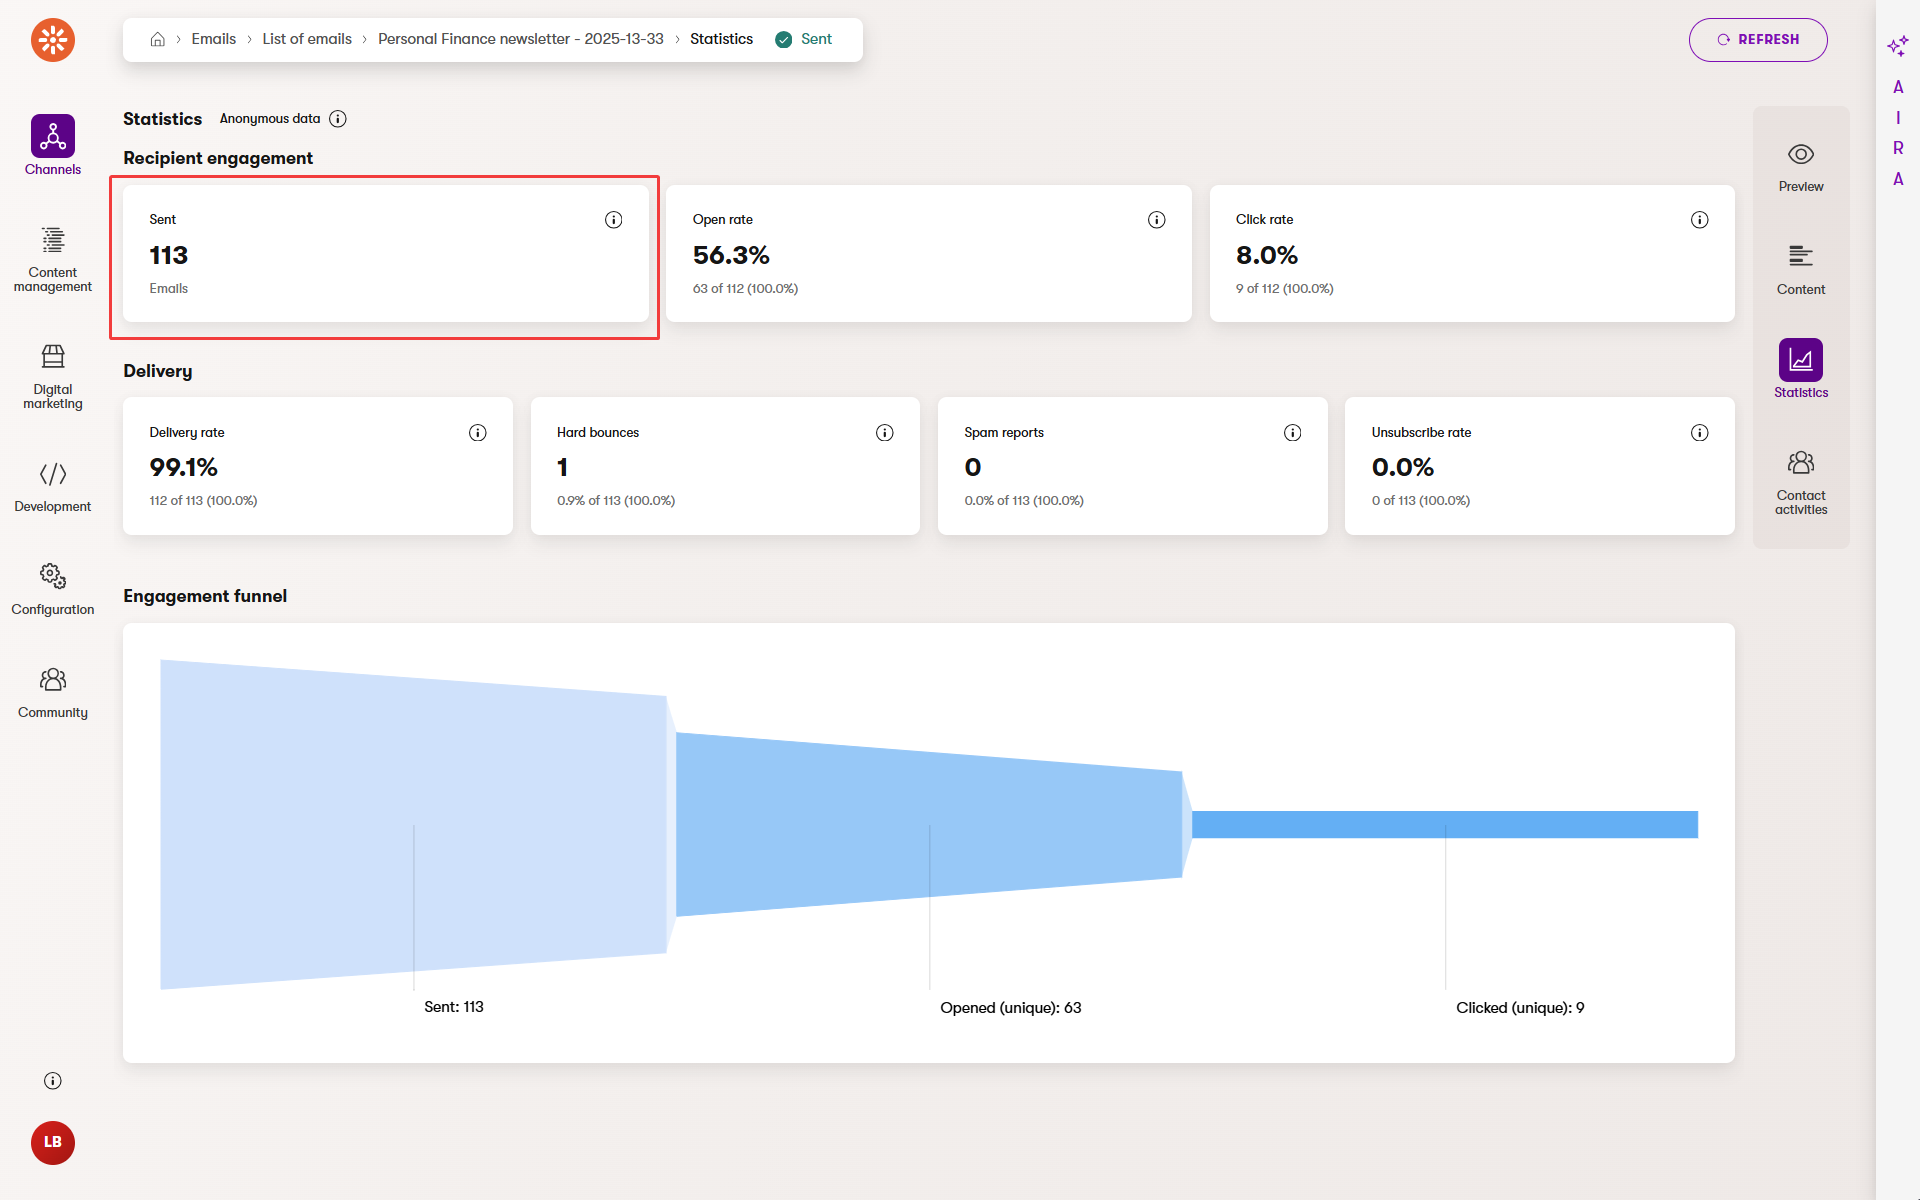
In some cases, Xperience can send the same email to the same recipient more than once. For example, if a visitor submits the same form multiple times , which triggers an email autoresponder, Xperience counts each send separately.
Check the Sent count to see the number of delivery attempts made, but use the Delivered count to measure actual inbox success.
Delivered emails
The number of regular emails that reached inboxes. It subtracts hard and soft bounces (temporary or permanent failures) from the total sent. It is your most reliable indicator that your contact received the email.
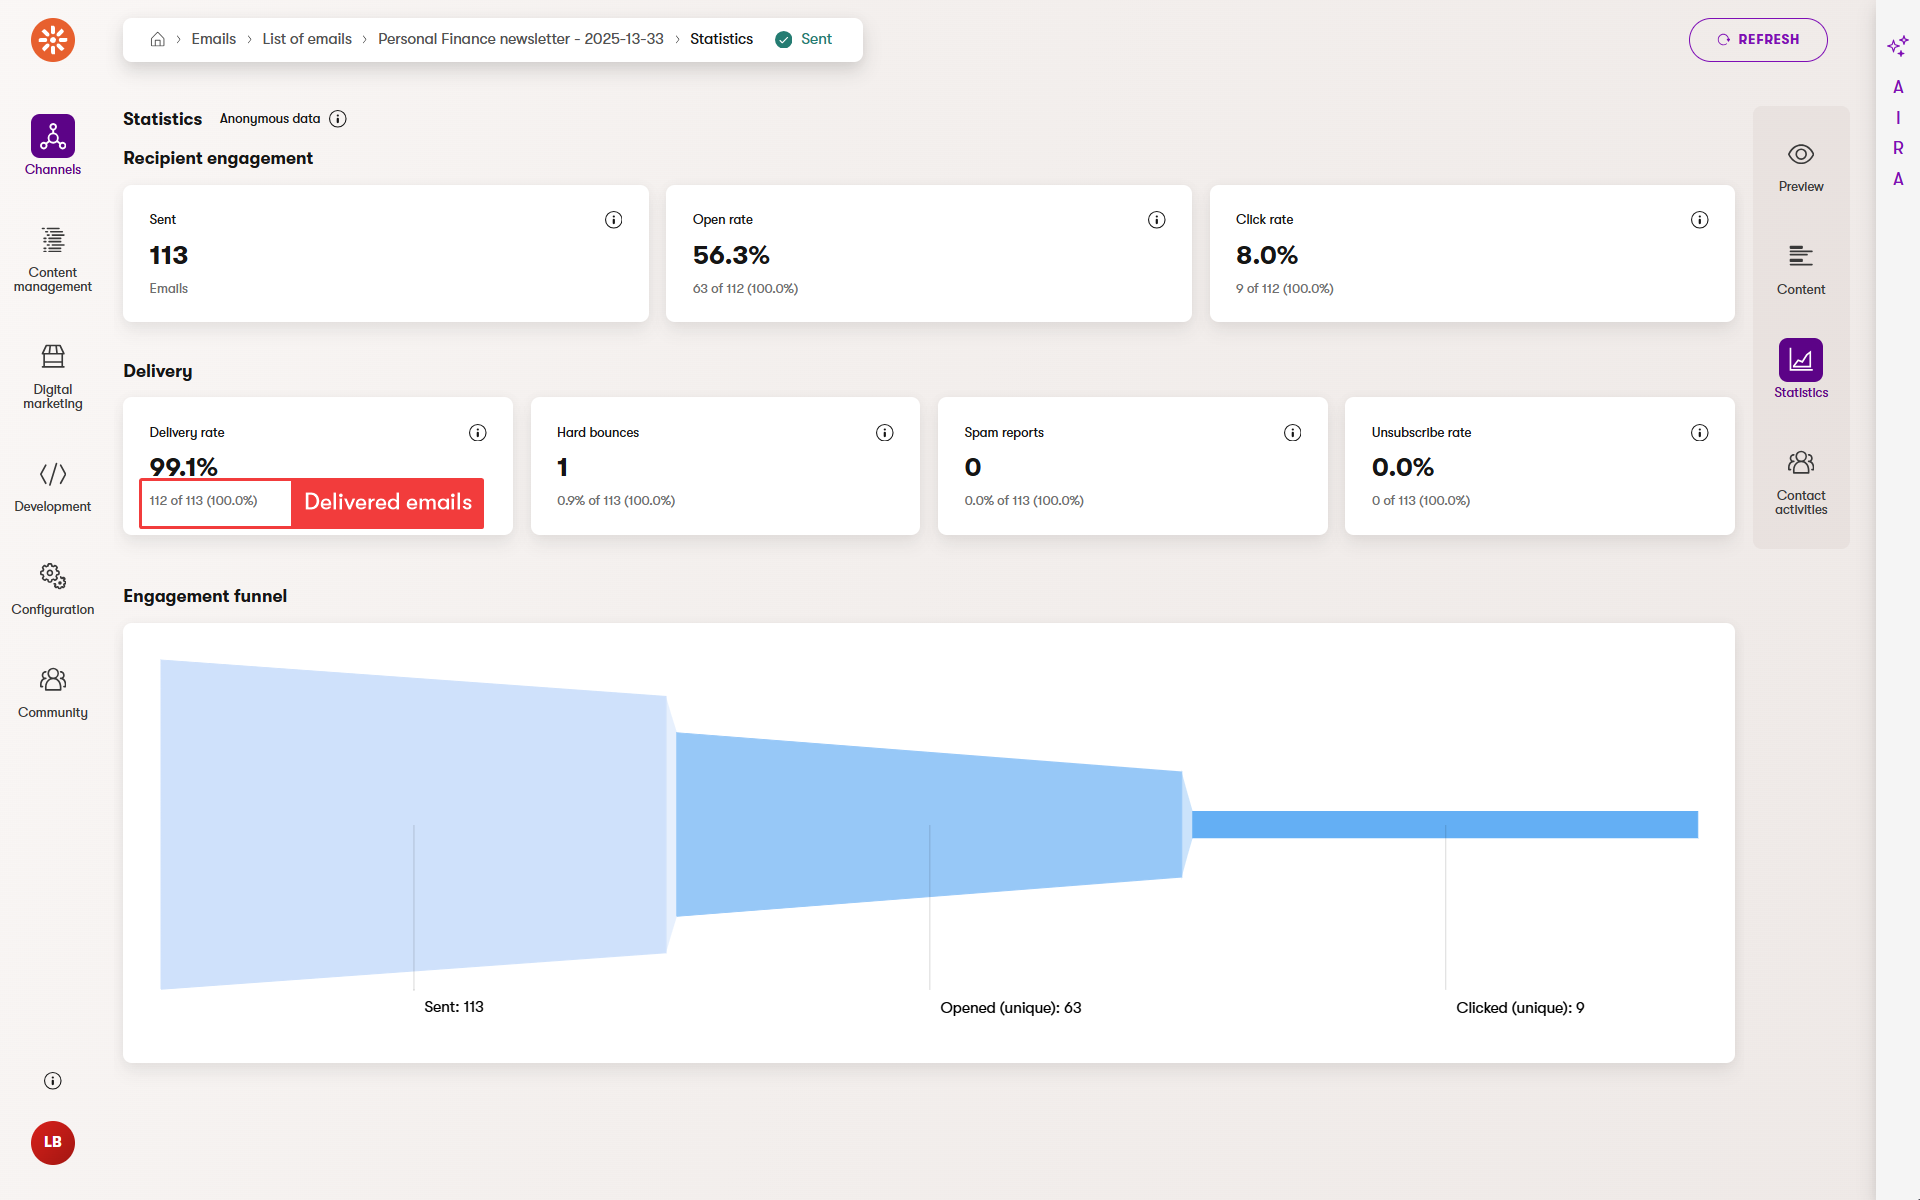
If an email address causes too many soft bounces (temporary issues) or any hard bounce (permanent issue), Xperience automatically marks the contact as Bounced and excludes them from future sends. You can reset this manually for individual contacts in Contact management if needed. The report doesn’t show an empty box if no such event has occurred. That’s why the following screenshots shows only hard bounces box and not the soft bounces.
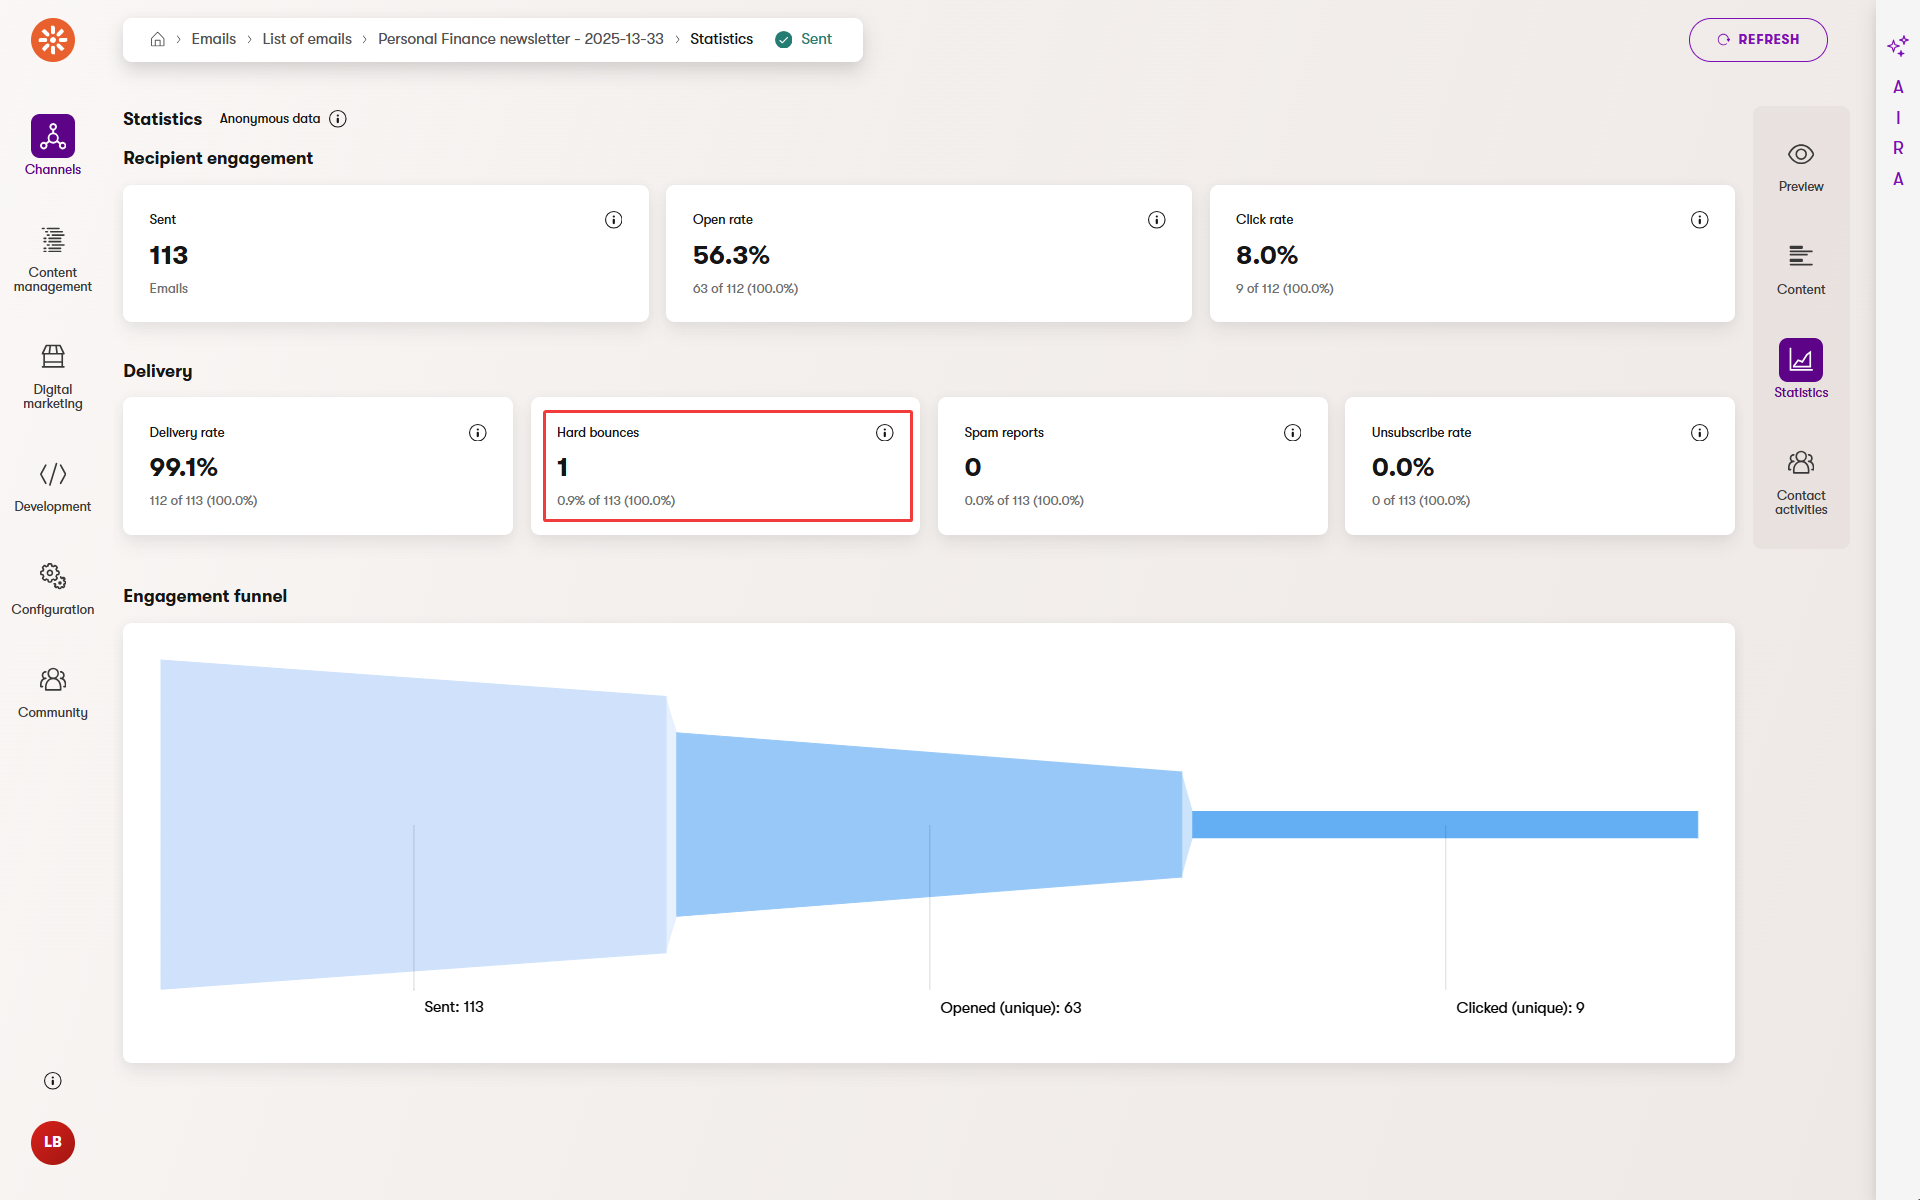
A falling delivery rate often points to problems with list quality. Try cleaning up inactive or outdated contacts to improve results.
Email opens
This tracks how many recipients opened your email. The system uses a small invisible image (called a tracker pixel or tracking pixel”*) that loads when the message is opened. If the recipient’s email client blocks images, the email open isn’t tracked, unless they also click a link.Then, Xperience counts this as an open.

Privacy policies made email opens highly unreliable
Apple Mail Privacy Protection (MPP) preloads remote content, such as a tracking pixel, even blocks it to prevent senders from knowing if emails have been read. Xperience (and other senders) register an “open” event even if the user never actually read the email, or sometimes not at all if the provider blocks opening the tracking pixel.
Though Gmail or other third-party email clients don’t have an alternative to Apple MPP, their enhanced privacy or encryption features often turn off automatic image loading by default. This means that the open tracking fails as it requires explicit user action, which they might not make. These inbox tools, including Apple MPP, also mostly block or obfuscate IP-address locations, making the geographical data about email interactions imprecise.
In many cases default behaviors of email tools artificially inflate or deflate your email open statistics, which no longer represent real user engagement. As a result, you should shift your focus to more dependable metrics like clicks, conversions, or replies. Campaigns that rely on IP-based data, for example, the recipient’s location or open time, are also less effective because that information is now hidden.
Use open rate to get a general sense of visibility, but don’t rely on it alone. Email clients and services may skew results, so compare open rates with clicked links to get a better picture.
Clicked links
This is one of the most reliable signs of recipients engaging with your email. When you send the email, Xperience rewrites links in the email content into tracking links, which record clicks before redirecting users to the original target.
You can see:
- Click rate – percentage of recipients who clicked at least one link.
- Unique clicks – number of individual recipients who clicked.
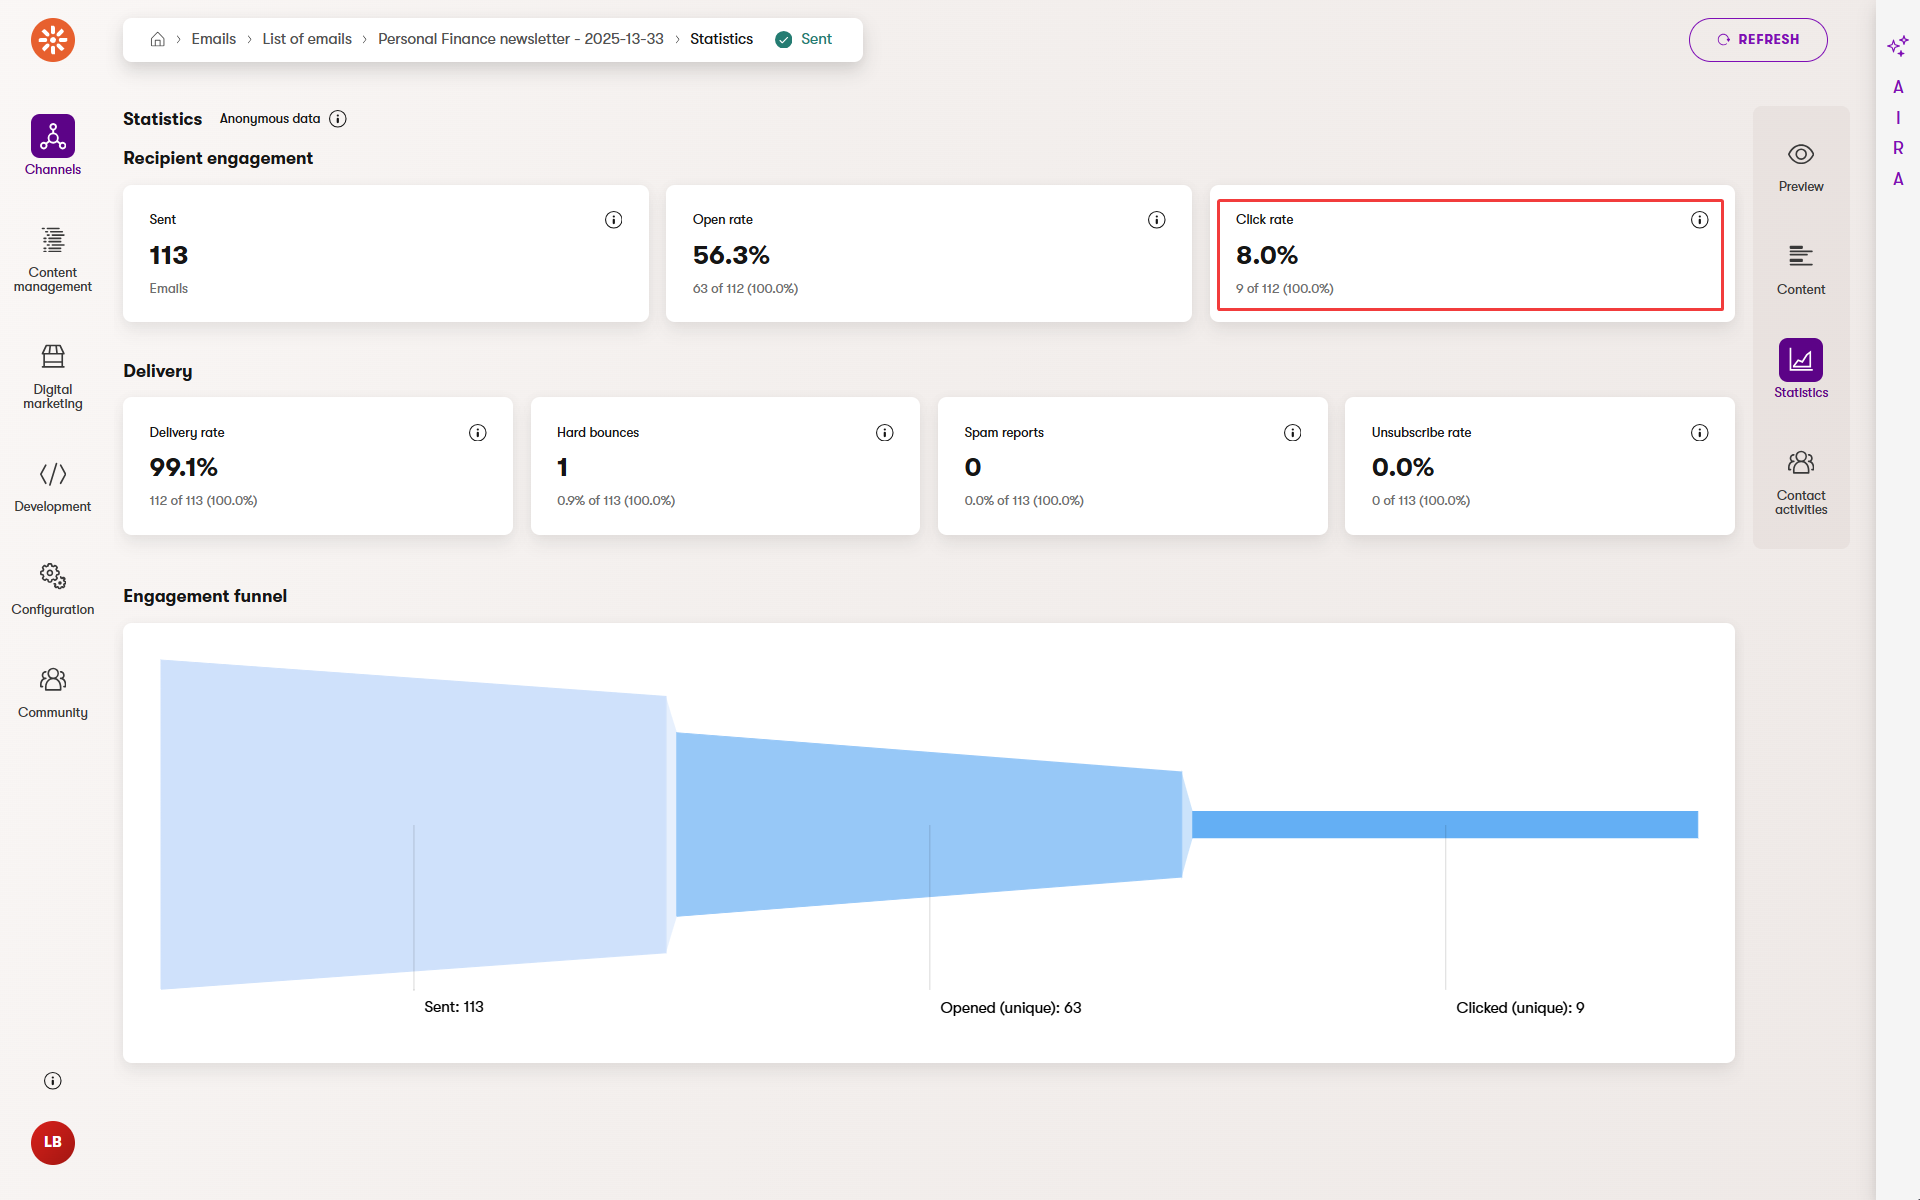
Click data for specific links is only available in contact activities, not in the anonymous statistics you have available in the email channel’s Statistics.
Clicks are harder to fake than opens. Track click rate over time to measure whether your content motivates action.
Unsubscribe links are not tracked. This ensures compliance and makes the opt-out experience clean and “by the book”.
Unsubscribe rate
The unsubscribe metric shows how many people clicked the opt-out link in a regular email. Xperience automatically removes these contacts from the recipient list and they won’t receive future messages that you send to this recipient list.
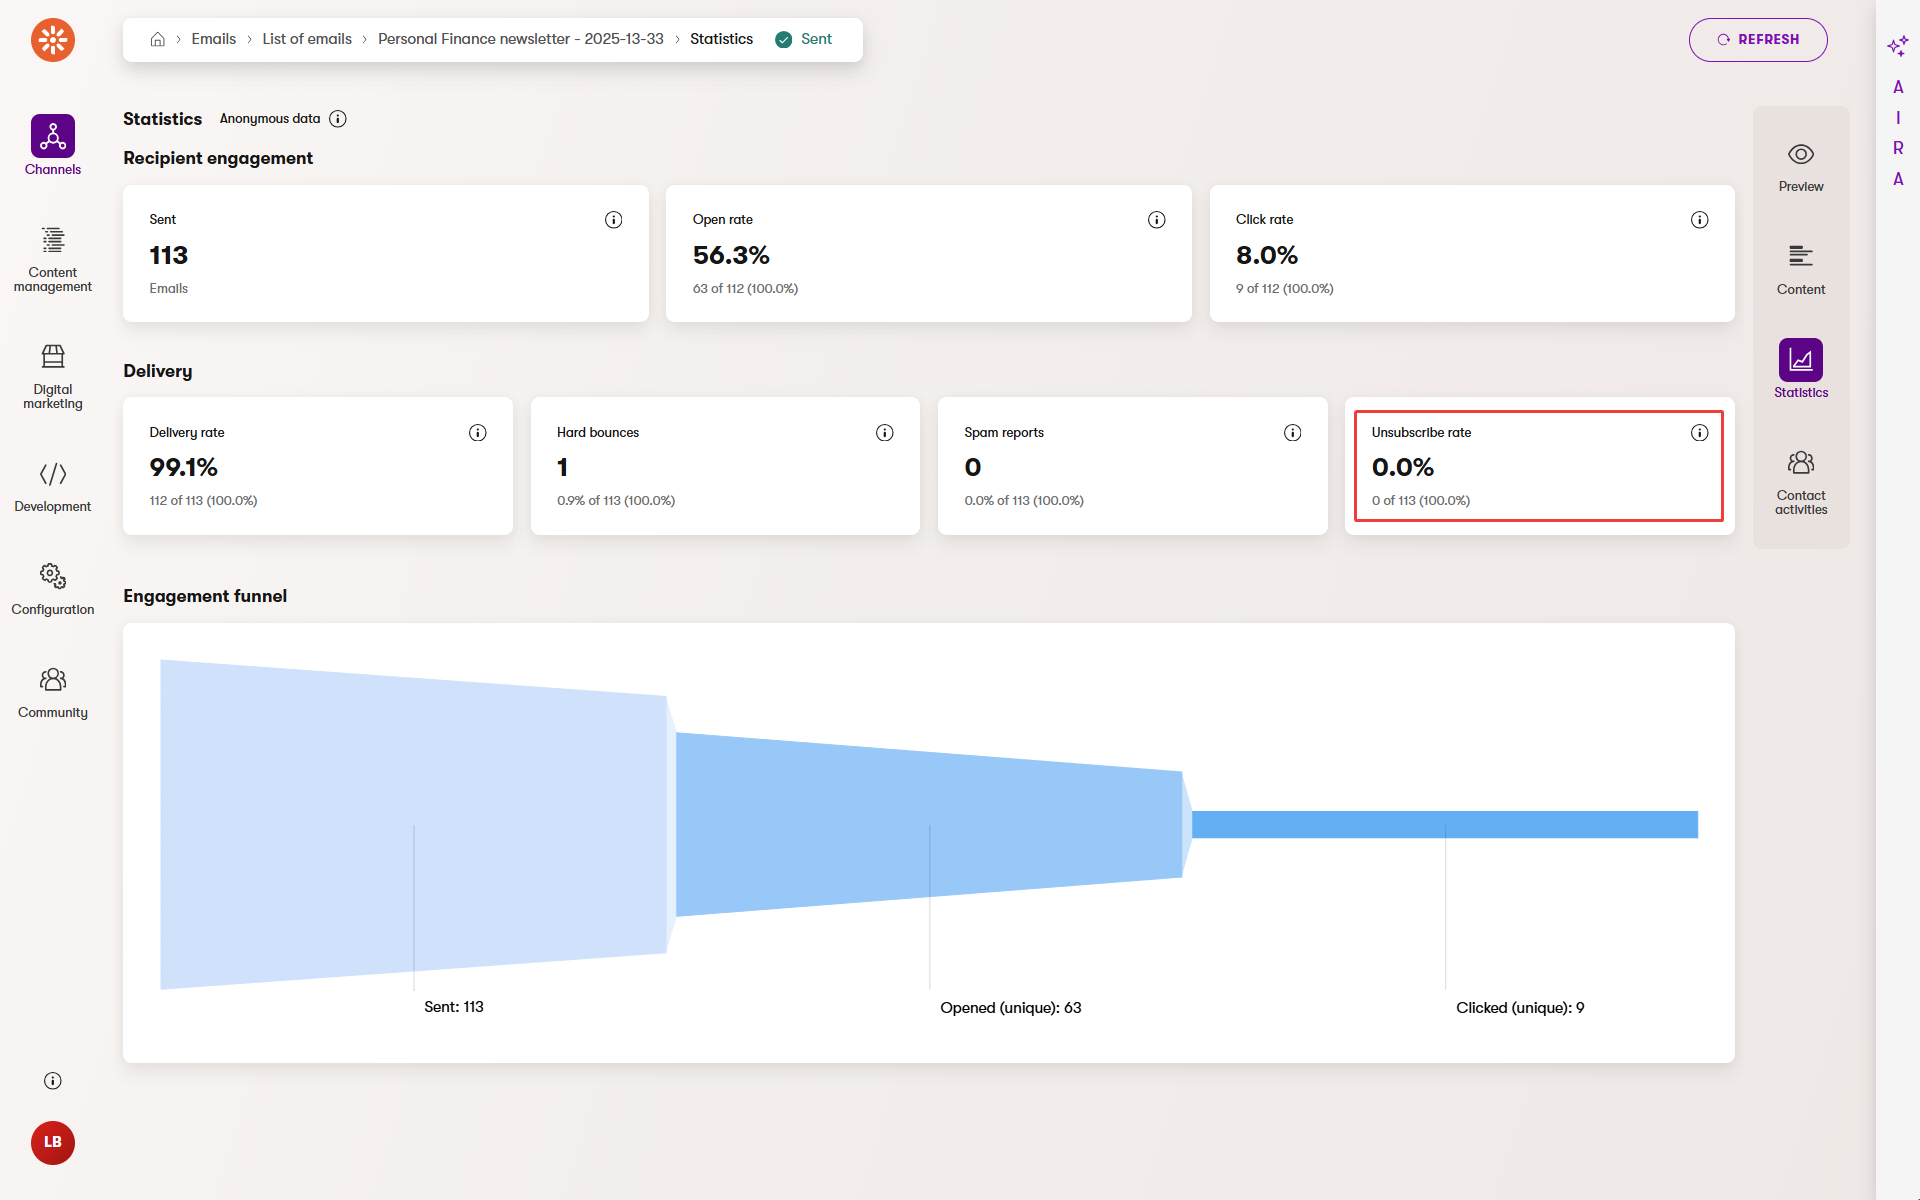
Xperience calculates the unsubscribe rate based on the number of emails that were successfully delivered. A few unsubscribes are normal. But if the number of unsubscribes starts rising, it’s a signal that something may not be working. It might mean the content you sent is irrelevant or you’re emailing too often.
Facing too many unsubscriptions?
- Review emails with high unsubscribe rates. Look at your subject line, frequency, and whether you’ve sent relevant emails to relevant recipients. Try small changes in tone or timing to rebuild trust with your audience.
- A higher unsubscribe rate doesn’t always mean failure. Remove disengaged users to keep your list clean.
- Check how many recipients opted out of future emails after receiving this one. A small number is normal, but consistent spikes should prompt a review of your content and targeting.
Spam reports
Spam reports show how many recipients marked your email as spam in their inbox. This metric is only available when you’re using SendGrid to send emails, as is the case for SaaS in Xperience.
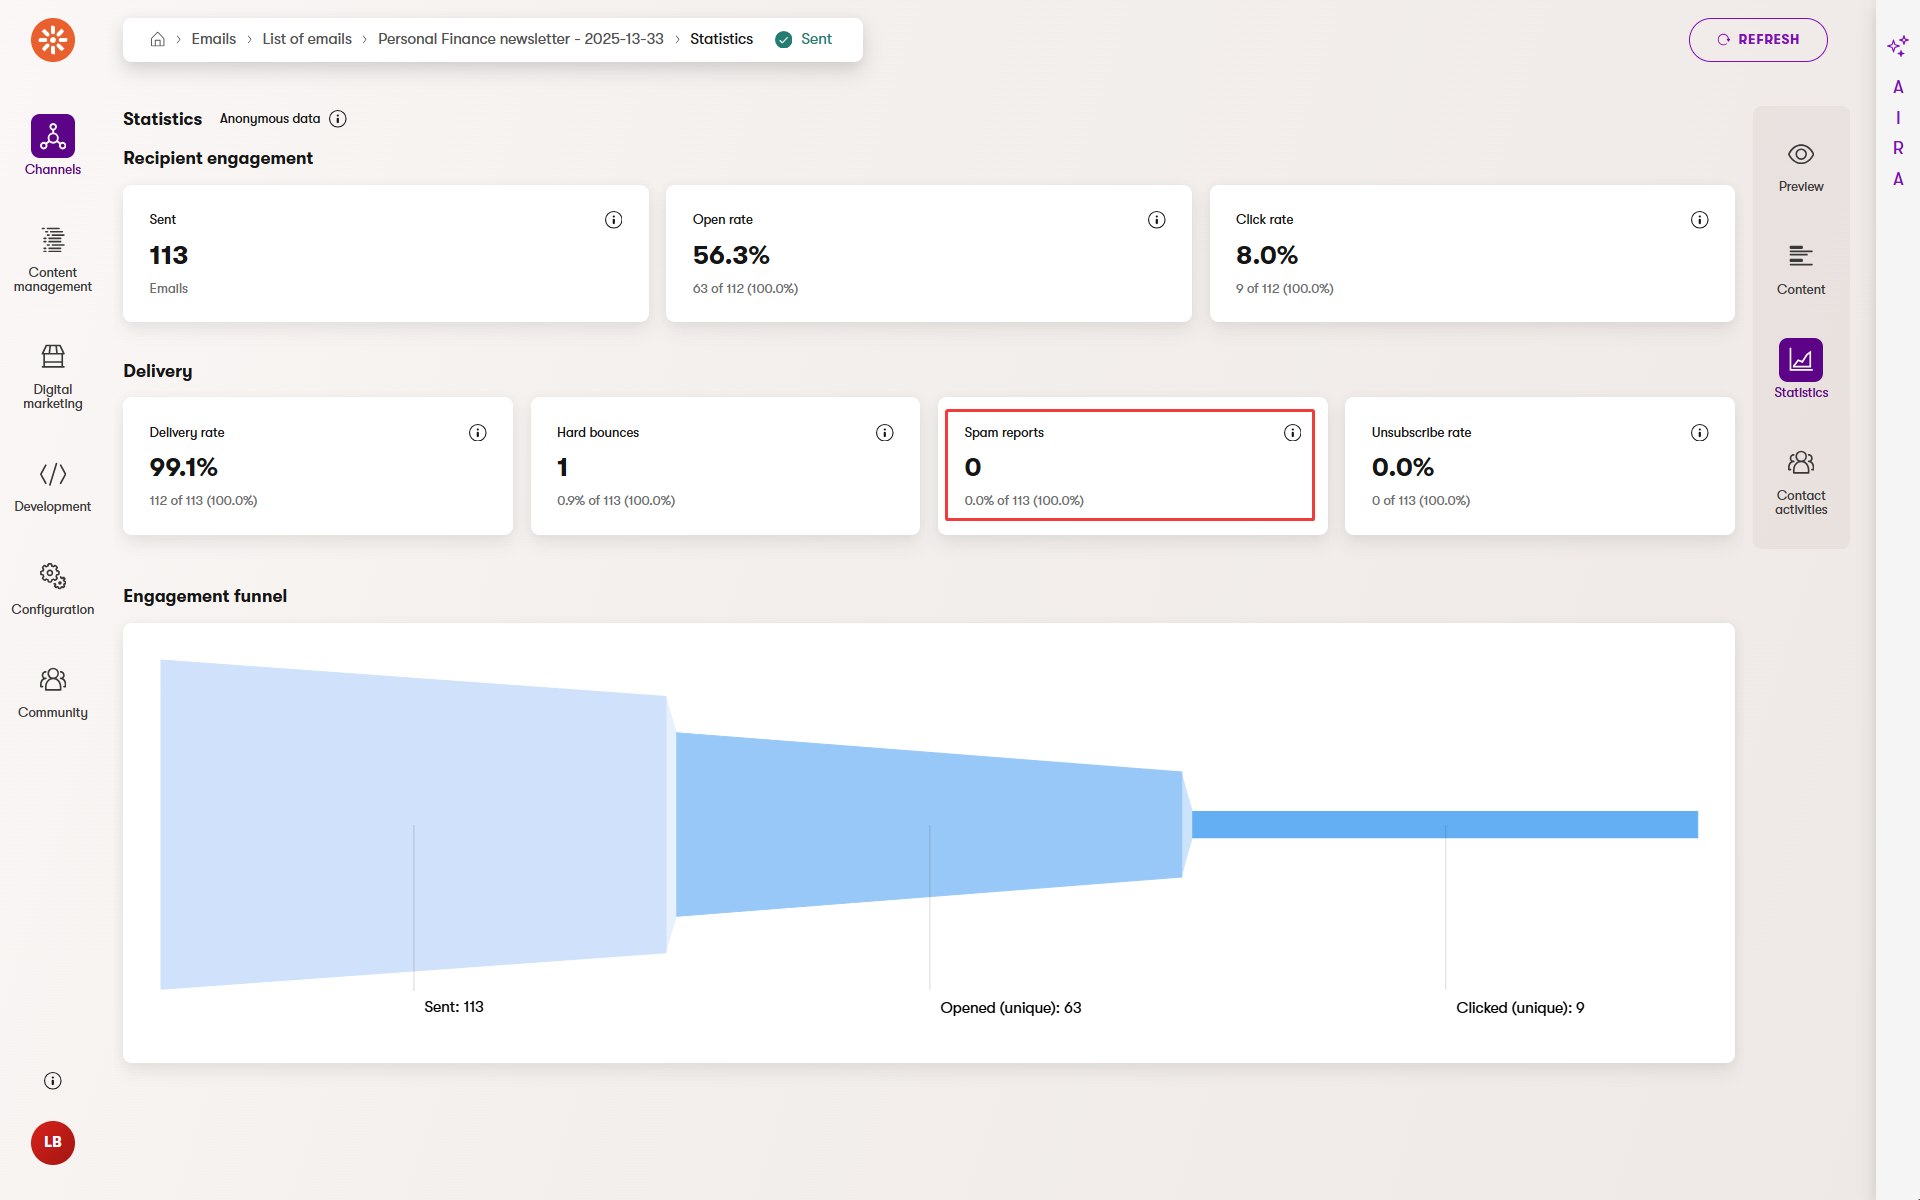
In Xperience, spam complaints from SendGrid are pulled into the system automatically. But if you’re running a custom SMTP server or a custom-tailored delivery setup that combines different email servers, developers may be able to implement their own version of spam reporting.
Leverage custom spam report implementations
Behind the scenes, all major email service providers (ESPs) offer tools that allow developers to access spam and complaint data programmatically, depending on the email provider’s features. These are sometimes referred to as complaint APIs, feedback loops, or simply FBLs. For example, Amazon SES uses Amazon SNS to send automatic alerts when a user flags an email. Mailgun, Mailchimp, Postmark, or Mailtrap all provide APIs that let developers track, fetch, and manage spam complaints. Some platforms, like MxToolbox, even aggregate complaints from multiple inbox providers into one dashboard.
Even a few spam complaints can hurt your sender reputation and reduce future deliverability, so it’s critical to monitor this metric closely.
Too many complaints?
Review your opt-in process and email content if you’re running into repeated spam complaints. Developers can also explore spam reporting integrations with your email infrastructure to catch issues early.
Find out who clicked and what they clicked
While overall statistics give you a snapshot of email performance, contact activities help you zoom in and see what individual users did with your message. This view is especially useful if you want to target engaged recipients, build smarter segments, trigger follow-up actions in automation, or improve customer journeys.
To view activities of individual contacts for a specific email, open the email in the email channel application and switch to the Contact activities view in the panel on the right. You’ll see a list of recipients who interacted with the email with their activity, such as a click. Xperience displays the exact link they clicked in the Value column.
Xperience tracks email click activities for contacts who have consented to tracking.
Your project’s consent policy typically controls consents. If someone hasn’t agreed to be tracked, their activity won’t appear in the Contact activities. Their clicks will still be counted anonymously in the overall email statistics that serve as an aggregated overview.
If you compare total clicks in the statistics view with individual clicks in Contact activities, don’t be surprised if the numbers don’t match. Anonymous clicks and identified clicks are logged separately.
Once logged, contact activities become powerful data points you can use across the platform. You can segment your audience using Email click conditions, personalize your digital marketing content on websites or in emails on their behavior, or build automated processes that respond when a contact clicks in an email to access something important like a pricing page, demo registration form, or a product features overview.
Combine contact activities with email widgets to personalize the email content. If someone clicked a specific type of content in the past, you can tailor the following email they receive to show similar or complementary content.
Make sure your forms and subscriptions collect consent for tracking. Without consent, you’ll lose visibility into who’s engaging with your business and miss opportunities to act on those signals.
Check these before jumping to conclusions
Email statistics in Xperience give you valuable insights, but only if you understand how and when Xperience collects the data. These quick tips will help you avoid common misunderstandings and make you more confident when you dive into your reports.
Email stats don’t update instantly
Email statistics in Xperience refresh automatically, but not in real time. It can take up to 30 minutes for new data to appear, especially after sending an email blast.
If you don’t see expected results right after sending, give it some time or use the Refresh button to manually reload the latest data.
Test sends and drafts don’t count
Xperience collects statistics only for emails sent through email channels. Sent drafts or links clicked in email previews won’t appear in your performance reports.
To confirm your setup is working, send a small live campaign to internal contacts first. You’ll see how your stats populate in a real-life scenario.
Watch for high bounce or unsubscribe rates
A spike in bounces or unsubscribes often points to issues with contact quality or content relevance. These numbers affect both deliverability and audience trust.
If you see frequent soft or hard bounces, review your contact lists for outdated or invalid emails. For unsubscribes, revisit your subject lines, email frequency, and overall value your emails deliver to your readers.
Consent affects what you can track
Some metrics – especially contact activities – depend on tracking consent. Without it, you’ll only see anonymous data, which limits personalization and automation options.
Make sure your forms and subscription points clearly request consent for tracking. Even a simple checkbox can help unlock richer insights later.
Wrap up
Email statistics help you understand how your messages perform and where to improve. When you learn what each metric means and how to read it correctly, you can spot what’s working, fix what’s not, and drive your marketing activities with data-informed decisions.
Focus on reliable signals like clicks and delivery rates, and use contact activities to take personalized action when possible. Don’t forget to watch bounces, unsubscribes, and spam reports. They’ll tell you just as much as the other metrics that only show how good your email program is.
Most importantly, use the insights to improve your next email. Email statistics are there to help you improve, not just to fill out a report.