
Manage SaaS deployments
Use Xperience Portal (available at https://xperience-portal.com) to manage your Xperience by Kentico applications deployed in the SaaS environment.
Overview
You need to upload a deployment package to your Xperience Portal project to trigger an initial deployment to the QA environment. After a successful deployment, you can access the deployed application and manage the SaaS deployments within Xperience Portal, which enables you to:
- Add and configure your content channels.
- Debug the deployments by examining the deployment Logs in the Deployments application.
- Manage restore points and exports of your deployed application.
- View outages for your application deployments and the Xperience Portal project.
- Monitor the event log and exceptions of application deployments.
- Evaluate the performance metrics of your applications.
- View security events and threats detected by Cloudflare CDN.
- Monitor the uptime of your deployed applications with uptime checkers.
Access deployed applications
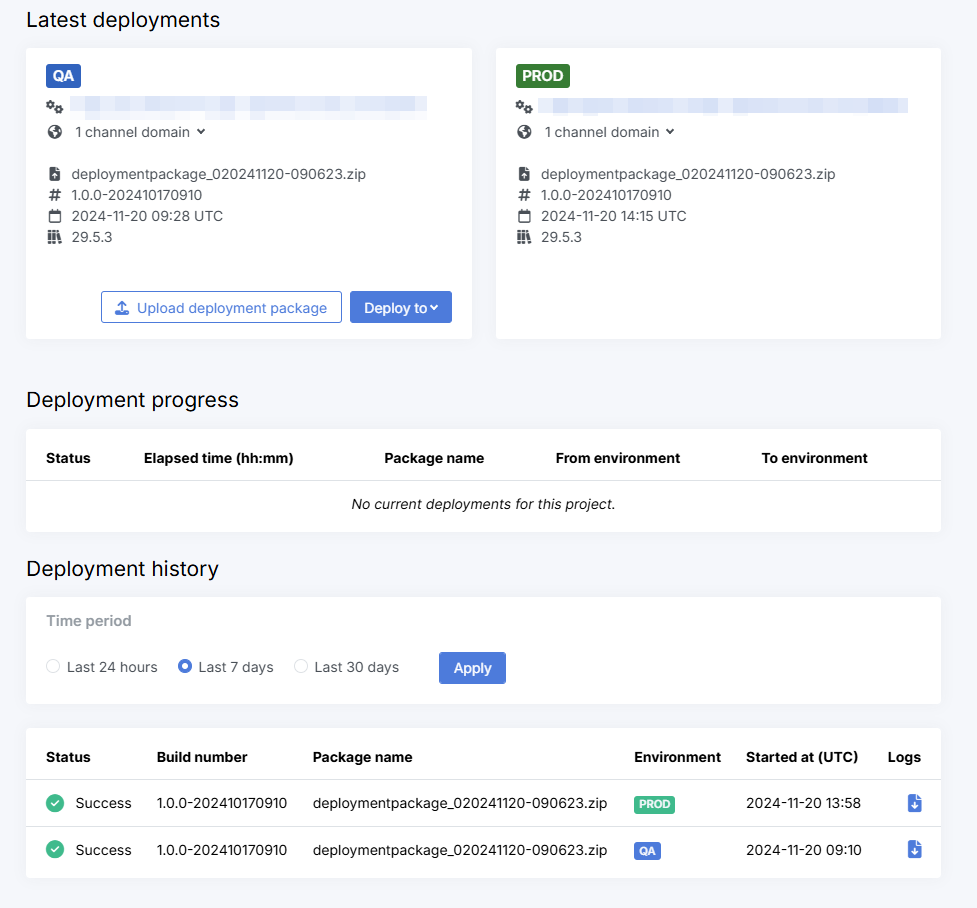
After successfully uploading the deployment package to the QA environment or deploying the package to another deployment environment, use the application URL displayed in the Deployments application under Latest deployments to access the deployed application.
Each project has a default system domain in format: <environment>-<project_code_name>.xperience-sites.com
The default domain can be used to access the project’s administration UI by appending the /admin path to the URL. You can view your project’s default system domains or customize your system Email sending and Email service domain in the Channels and Domains → System domains application in Xperience Portal.
Additionally, projects also have domains for individual website and email channels. You can set up custom domains for website and email channels in the PROD or STG environment. To learn more, see Website channels in the SaaS environment and Email channels in the SaaS environment.
Restart deployed applications
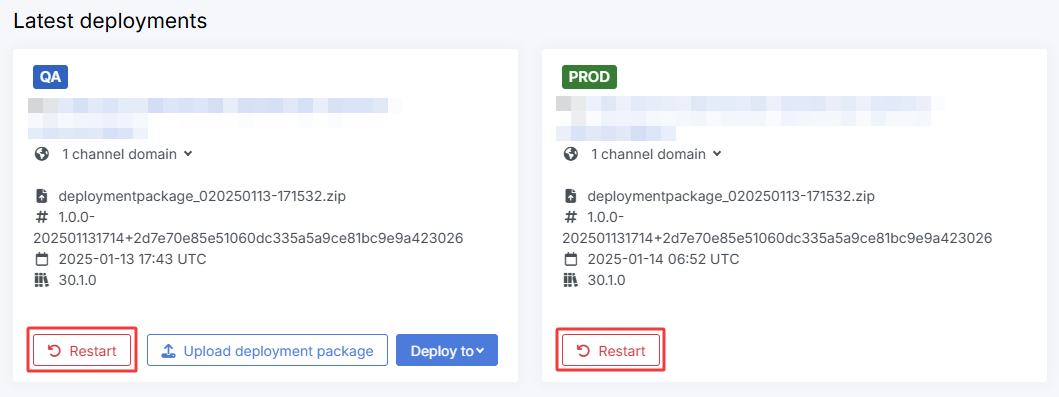
If you encounter any issue that requires you to restart the Xperience by Kentico application, you can restart the application in the administration interface. However, when you cannot access the administration interface, you can restart the application from Xperience Portal.
- Access your Xperience Portal project.
- Navigate to the Deployments application.
- Restart the desired environment.
- For non-production environments (QA, UAT), the Restart button is available to all portal users. However, only users in Tenant Administrator or DevOps Engineer roles can restart production environments (PROD, STG).
- Wait until the restart is finished.
Channel management
Content in Xperience by Kentico is encapsulated within channels, which are bound to specific domains. To allow the content to be presented by deployments in the SaaS environment, you need to add and configure all website and email channels within Xperience Portal in the Channels and Domains application.
For detailed information, see:
- Website channels in the SaaS environment
- Email channels in the SaaS environment
- GraphQL API endpoints
Restore points and exports
The SaaS environment uses a two-tier system consisting of restore points and exports to ensure data protection and disaster recovery. This system allows you to restore previous versions of your project for a particular environment.
Xperience Portal creates automatic restore points and exports, and you can also create manual restore points and manual exports for production and non-production environments. Restore points and exports are managed in separate applications:
- Restore points can be viewed, managed and restored under Data Management → Restore points
- Exports can be created and downloaded under Data Management → Exports
The separate Restore points and Exports applications are available for projects with version 30.1.0 or higher deployed across all environments. Projects with earlier versions continue to use the combined Backups application.
Applications deployed in the SaaS environment consist of the following services:
- Application service – application binaries and runtime files
- Database – reflects the current state of the environment’s database
- Storage – reflects the current state of files in the environment’s Azure Blob storage
Restore points vs. exports
Understanding the difference between restore points and exports is crucial for effective data management:
Restore points:
- A timestamp referencing the application state at a given time, allowing you to restore the application to that previous state
- Fast to create as no physical data copying occurs
- Always include restore points for all three services (application, database, and storage)
- An Application service restore point is a snapshot of the deployment package. If nothing has been deployed yet, you can download the intial Application service files
- Created automatically before deployments, manually on demand, or on a regular schedule
- Cannot be used to download data (with the exception of Weekly restore points). To download data, you must create an export.
Exports:
- Physical copies of data that can be downloaded for inspection, debugging, or long-term storage
- Slower to create (depends on the amount of data) as files are physically copied
- Can be full (all components) or partial (selected components only)
- Cannot be used to restore the application
- Service components included in exports:
- Application service – copy of all files from the application service file system
- Database – exported as a
bacpacfile - Storage – copy of files from Azure Blob storage
- Limited to 30 exports per component per environment per month (may be adjusted with custom plans)
- Exports that include the Database component can appear in the Exports application before the database export is fully finalized. In this state, database download remains unavailable until processing is complete.
- Exported files are retained for 60 hours after creation and must be downloaded before automatic removal
Automatic restore points and exports
Kentico automatically creates the following restore points and exports:
- For all environments:
- Pre-deployment restore points which expire in 30 days. The system creates a restore point for each service to make deployments faster:
- Application service – if nothing has been deployed yet, an export of the current application service file system is created instead
- Storage – restore points are always created
- Database – restore points are created only when all project environments have Xperience by Kentico version 30.1.0 or higher deployed and all existing backups are from 30.1.0 or higher
- Pre-deployment restore points which expire in 30 days. The system creates a restore point for each service to make deployments faster:
- For the Staging or Production environment:
- Daily restore points with a retention policy based on your service plan:
- Level 1 – 3 days
- Level 2 – 3 days
- Custom – 7 days or more
- Daily backups always use restore points only
- Application service restore points are snapshots of the deployment package. If no deployment package has been deployed yet, the daily backup may contain a downloadable application service export instead.
QA environment daily backups
All standard service plans (Level 1, Level 2) have QA daily backup retention set to 0 days, so the QA environment does not have any daily backups. Only Custom service plans can configure QA daily backup retention.- Weekly restore points (created on Sundays) with a retention policy of 30 days
- Downloadable export data is included for all components, which allows you to download the data for long-term storage purposes while also providing fast restore point functionality
- Weekly restore points are displayed only after related database export finalization is complete
- Daily restore points with a retention policy based on your service plan:
See SaaS service plans for information about service plans and Licensing Xperience by Kentico SaaS for information how to change to a different service plan.
Create a manual restore point
You can create manual restore points for both production and non-production environments.
The retention policy for manual restore points is:
- Restore points:
- Level 1 service plan – 3 days
- Level 2 service plan – 3 days
- Custom service plan – 7 days or more
To create a manual restore point:
Navigate to Data Management → Restore points.
Select Create restore point in the upper-right corner.
Select the environment for which you want to create a restore point.
Only Tenant administrator and DevOps roles can access and create restore points for Production or Staging environments. See Reference - Xperience Portal user roles.
Select Create and wait for the restore point to be created.
SaaS processes (e.g., restore points, deployments) are queued, and you can have only one process running at a time.
Your restore point is now available in the Restore points application under Data Management.
Create a manual export
The export process creates physical copies of the data, which can then be downloaded. Exports are limited to 30 exports per component per environment per month (may be adjusted with custom plans).
To create a manual export:
Navigate to Data Management → Exports.
Select Create export in the upper-right corner.
Select the environment for which you want to create an export.
Only Tenant administrator and DevOps roles can access and create exports for Production or Staging environments. See Reference - Xperience Portal user roles.
Select what components should be included in the export.
Select Create and wait for the export to be created.
SaaS processes (e.g., restore points, deployments) are queued, and you can have only one process running at a time.
Downloading exports allows you to inspect the state of the application, debug the database or check the integrity, versions, and number of files in the deployment environment.
Contained users authentication
Enable contained users authentication on your local SQL Server to be able to use the exported database backups.
Restore from a restore point
You can restore your application to a previous state using restore points. This is useful if you need to revert changes or recover from an issue.
Downtime during the restore
Restoring from a restore point causes downtime for the target environment. The application will be unavailable until the restore is complete. You can display a custom HTML page to inform visitors about the site’s status during the restore.
- Navigate to Data Management → Restore points.
- Select an environment and select Apply. A list of restore points for the environment is displayed.
- Restore from a restore point by selecting Restore () next to a restore point.
- On the Restore a restore point page:
- Select the exact restore point you wish to restore from.
- Choose an HTML page displayed on the live site during the downtime caused by the restore.
- You need to choose the HTML page each time you run a restore. The selected page is used only for that restore.
- The app offline page configured for downtime during deployment is not used for restores.
- If you do not select a page here, the system displays a default page with a generic offline message.
- Select whether to restore immediately or schedule the restore for a later date.
- Select Restore and wait for the restore process to complete.
Application monitoring
The Monitoring set of applications in the Xperience Portal are designed to keep your application running smoothly and provide full visibility into your application’s performance, enabling you to quickly detect and resolve issues, optimize performance, and ensure the best possible user experience.
- Outage monitoring
- Event log and exceptions
- Performance metrics
- Security events
- Alerts and email notifications
- Uptime monitoring
Outage monitoring
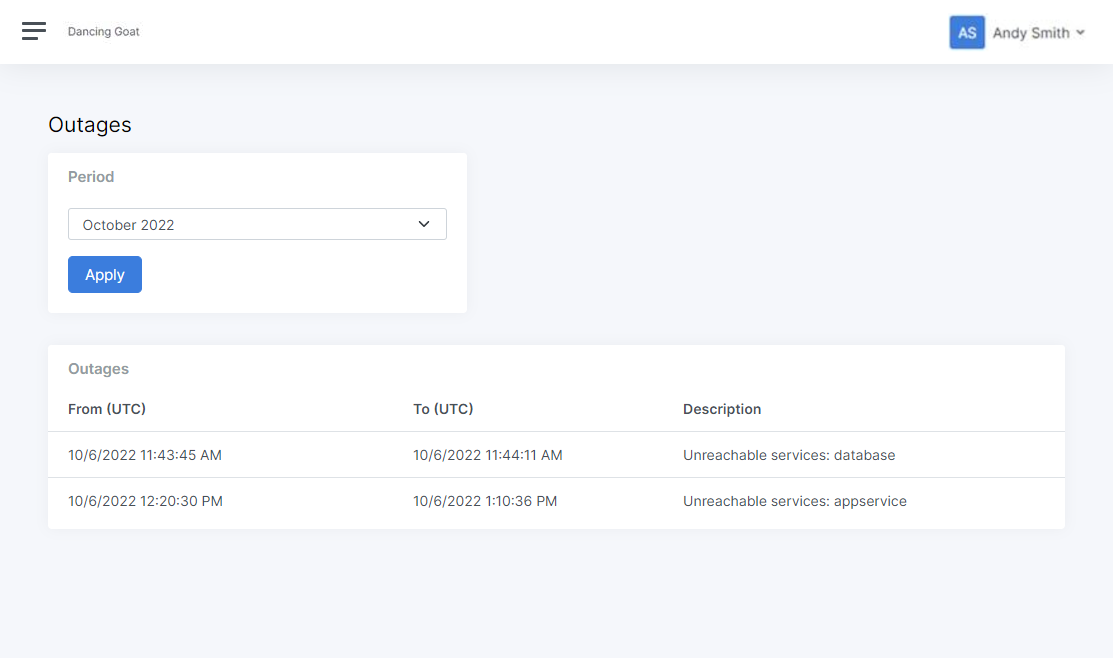
Use the Outages application under Monitoring in Xperience Portal to see a list of outages for your Xperience Portal project and deployed applications. Records include the time when the outage occurred and the cause of the outage. You can filter the outages by the month when they occurred.
Use Outage monitoring to track platform or project outage incidents. For endpoint-level availability checks of your application URLs, see Uptime monitoring.
Go to status.xperience-portal.com to see the uptime statistics for Xperience Portal. See Xperience Portal uptime statistics.
Your Xperience Portal project occasionally undergoes scheduled maintenance, during which certain Xperience Portal features may become unavailable.
Xperience Portal uptime statistics
Go to status.xperience-portal.com to see the statistics about the availability of:
- Xperience Portal
- Deployment API
- Production sites by region
You can also see the list of Past incidents below the statistics.
You can subscribe to the incident reporting to receive a message whenever Kentico creates, updates, or resolves an incident. Select Subscribe to updates at the top of the Xperience by Kentico status page.
Event log and exceptions
Xperience by Kentico integrates Application Insights for ASP.NET Core applications to enable monitoring and aggregation of metrics for your website. For detailed information about enabling the Application Insights integration for your projects, see Microsoft Application Insights integration.
To view the Application Insights logs for your deployments, use the following applications under Monitoring in Xperience Portal:
- Event log – displays entries from the Xperience event log and any custom messages sent via the Application Insights SDK.
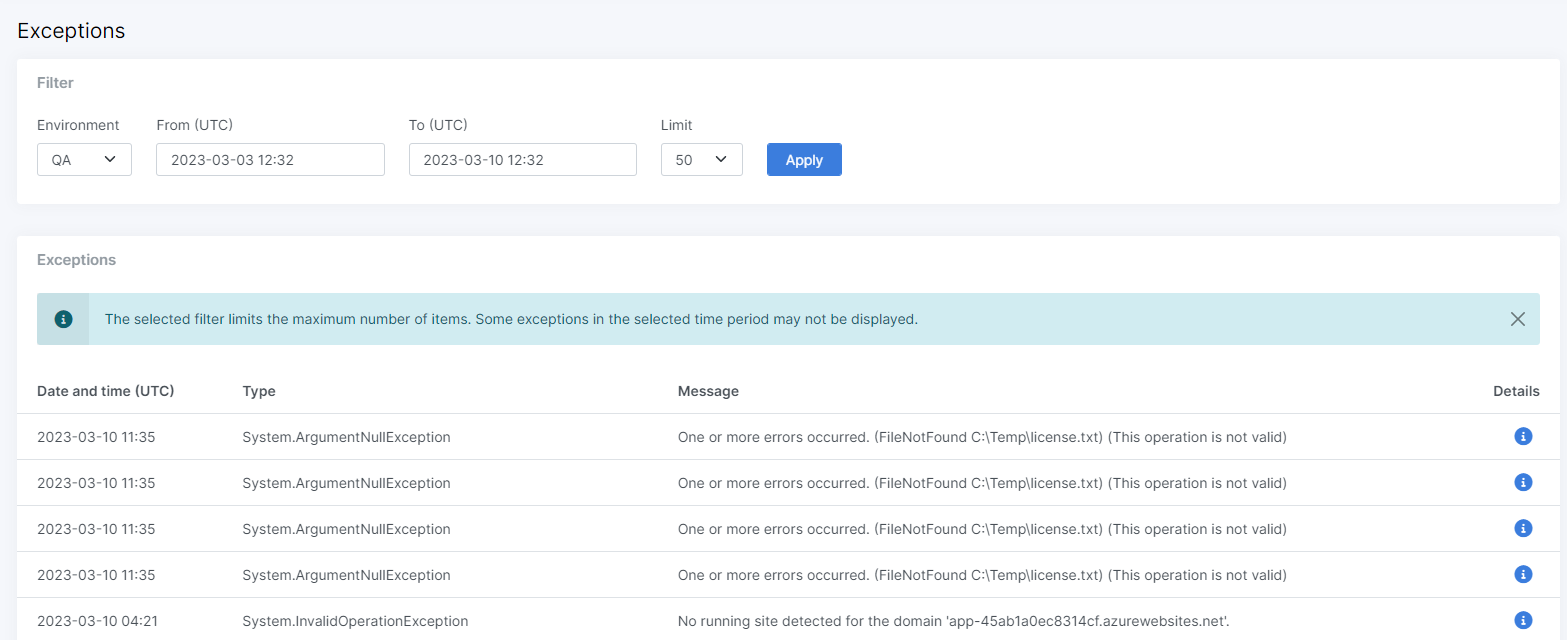
- Exceptions – displays all .NET exceptions (errors) from Application Insights. Includes exceptions that can occur before the Xperience application is fully running, in addition to errors in the Xperience event log.
You can filter the logs for individual deployment environments, and based on the time when the event occurred.
Log size limits
There is a daily limit on the size of the Application Insights logs. After the daily limit is reached, further logs are discarded.
The following table lists the daily limits for all deployment environment types and service plans.
|
Environment |
Service plan |
GB/Day |
|
QA |
All |
1 |
|
UAT |
Custom |
2 |
|
PROD and STG |
Level 1 & Level 2 |
3 |
|
PROD and STG |
Custom |
6 |
1 GB can store approximately 125 000 average-sized exceptions or event log records.
Performance metrics
Use the Project metrics application under Monitoring to see various performance metrics related to applications deployed to the SaaS environment. The available metrics include server errors, response time, CPU usage and memory usage. By tracking these metrics, potential issues can be detected and addressed before they impact users, bottlenecks and areas for optimization can be identified, resource utilization can be better understood, and insights can be gained to make data-driven decisions to improve and optimize the application.
To view performance metrics for various SaaS environments:
- In Xperience Portal, navigate to Monitoring → Project metrics.
- Select an Environment and a Time period, for which you want to display metrics.
- Apply the changes.
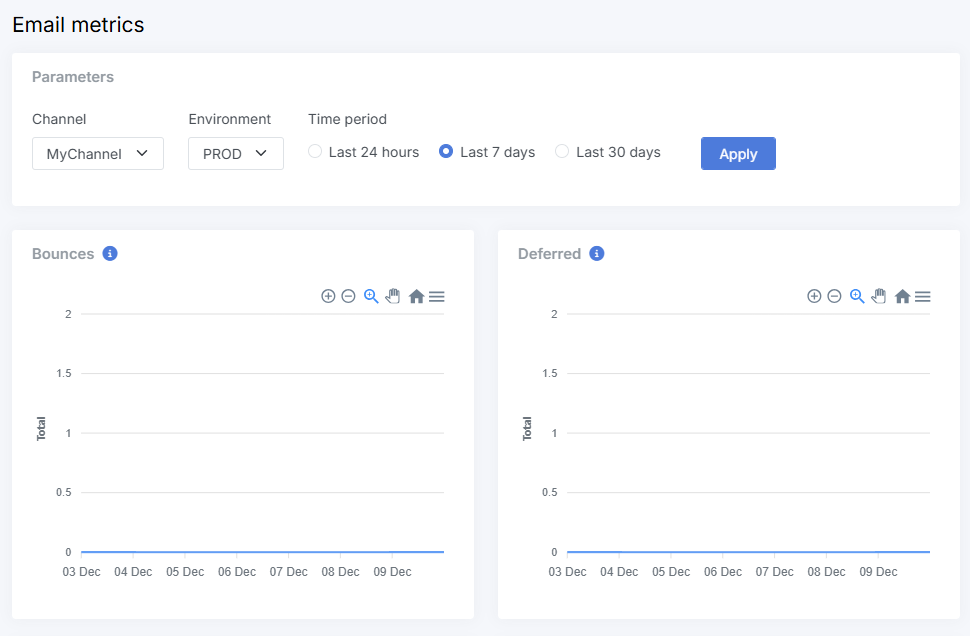
Email metrics
Use the Email metrics application under Monitoring to see email sending statistics from the SendGrid platform. The available statistics include total numbers of delivered, bounced, and deferred emails. You can also track the number of unique clicks in emails. These metrics help identify deliverability issues, optimize campaigns, and improve user engagement to drive better marketing performance.
To view email metrics for various email channels and deployment environment:
- In Xperience Portal, navigate to Monitoring → Email metrics.
- Select a Channel, Environment and a Time period, for which you want to display metrics.
- Apply the changes.
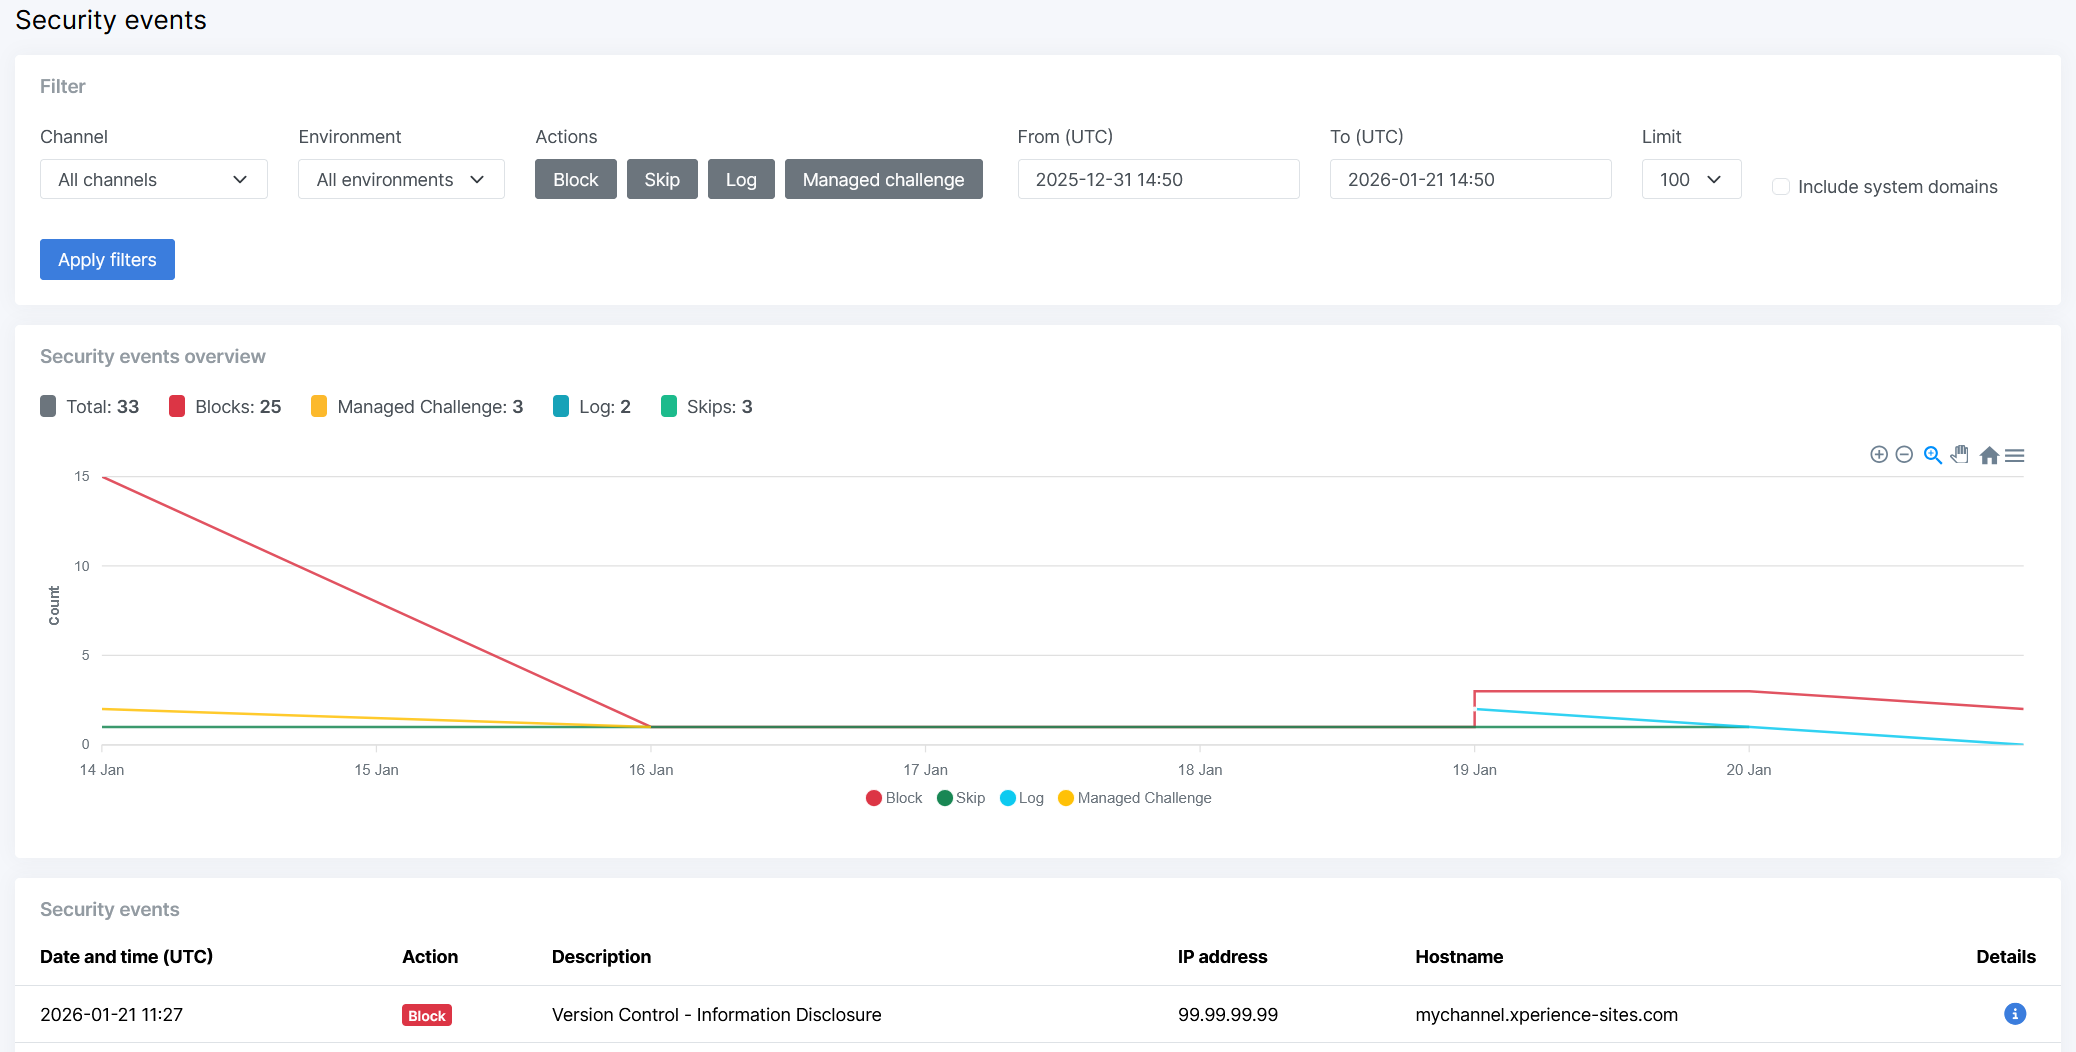
Security events
Use the Security events application under Monitoring to view security events detected and handled by Cloudflare CDN. The application provides an overview of security threats, including DDoS attacks, malicious requests, and other suspicious activities that Cloudflare automatically detects and mitigates.
Security event data is available for the last 28 days only. Events older than 28 days are automatically removed and cannot be retrieved.
Security events are categorized into the following action types:
- Block – Requests blocked by Cloudflare’s security rules
- Skip – Requests that bypassed certain security checks
- Log – Security events that were logged for monitoring purposes
- Managed challenge – Requests that received an automated challenge to verify legitimacy
To view security events for your project:
- In Xperience Portal, navigate to Monitoring → Security events.
- Use the available filters to narrow down the security events:
- Channel – Filter by website channel
- Environment – Select a deployment environment (QA, UAT, PROD, STG)
- Actions – Filter by action type (Block, Skip, Log, Managed challenge)
- From (UTC) and To (UTC) – Specify the time range for events
- Limit – Set the number of most recent events to retrieve from Cloudflare
- Apply filters to view the filtered results.
The Security events overview section displays the total count of security events in the selected time period, a breakdown by action type with color-coded indicators showing the number of events for each category, and a timeline chart visualizing security event trends over time, helping you identify patterns and potential attack periods.
The Security events table displays filtered events based on your selected parameters. To view detailed information about a specific event, including Cloudflare’s Ray ID, description, HTTP request details, and response information, select the Information () icon in the Details column.
Alerts
Alerts notify about potential problems with applications deployed to the SaaS environment. Most of the available alerts are based on performance metrics, such as application responses, server errors or CPU/memory/DTU utilization.
The system currently provides the following types of alerts:
|
Alert type |
Severity |
Alert conditions |
|
Application response |
Error |
An uptime checker’s endpoint availability dropped below 50% over the past 15 minutes. Uptime checkers send requests every 5 minutes. |
|
CPU utilization greater than 80% |
Error |
The application’s average CPU utilization over the past 30 minutes was above 80%. |
|
Memory utilization greater than 90% |
Error |
The application’s average memory utilization over the past 30 minutes was above 90%. |
|
DTU utilization greater than 90% |
Error |
The application’s average Database Transaction Unit (DTU) utilization over the past 30 minutes was above 90%. The DTU utilization metric is calculated as the ratio of used DTUs to the total DTUs available for your project’s plan. |
|
DTU utilization greater than 70% |
Warning |
The application’s average DTU utilization over the past 30 minutes was above 70%. The DTU utilization metric is calculated as the ratio of used DTUs to the total DTUs available for your project’s plan. |
|
Failed requests (Server errors) |
Error |
More than 5% of web requests sent to the application over a 30 minute interval resulted in a failed status, i.e. returned a 5xx HTTP status code. |
|
Failed deployment |
Error |
Deployment of a package failed. |
|
Service scaling |
Warning |
A production environment was scaled out to the maximum number of allowed instances over the past 360 minutes. Typically occurs due to auto-scaling under heavy load. Only applies to projects with a custom service plan, which can allow scaling to 3 or more service instances. |
|
Cloudflare DDoS attack |
Warning |
An HTTP DDoS attack has been detected on one of your domains. These attacks are automatically detected and mitigated by the Cloudflare CDN. View detailed security event data in the Security events application. |
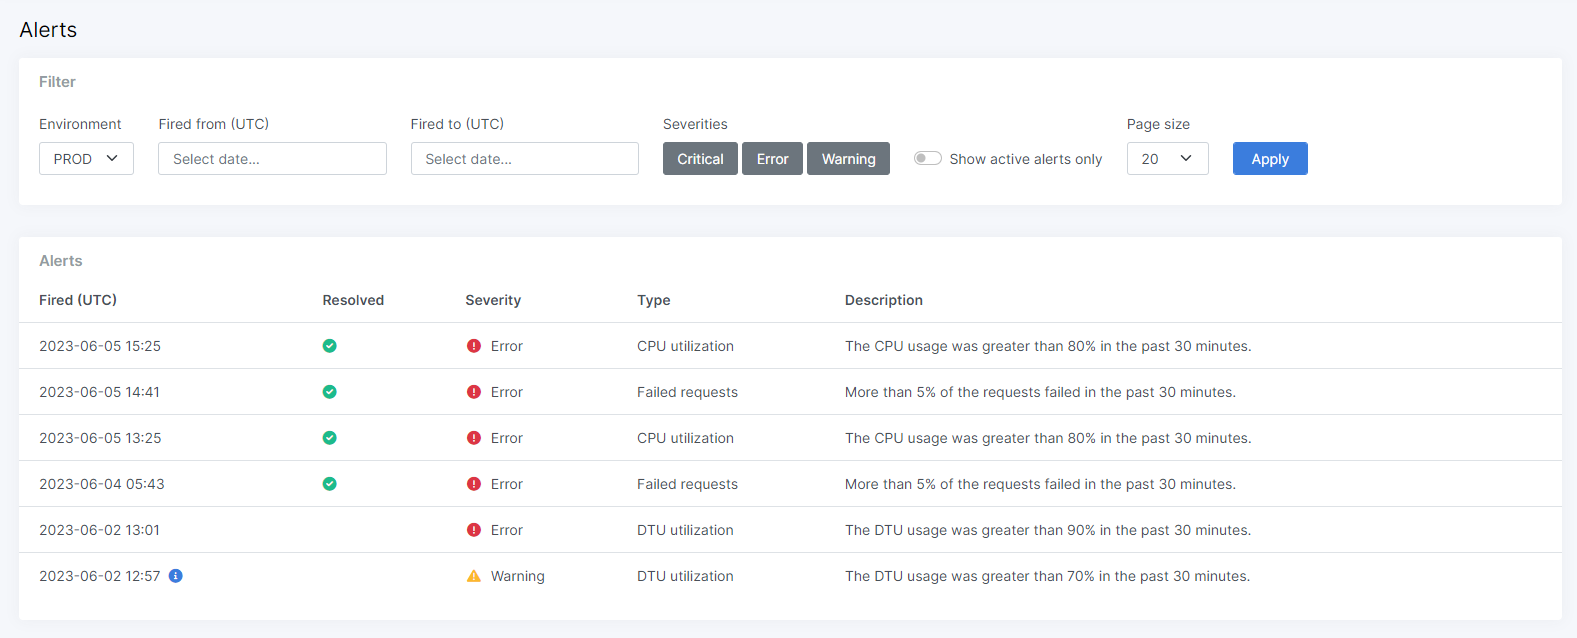
To view alerts for your project’s deployments, navigate to Monitoring → Alerts in Xperience Portal. You can filter the alerts for individual deployment environments, based on the time when the alert was fired, and the alert severity.
Alerts are displayed with the Resolved flag if the conditions that caused the alert to fire no longer apply. For example, a CPU utilization alert will be resolved after the average utilization drops under the 80% threshold over 30 minutes. Select Show active alerts only in the filter if you wish to see only unresolved alerts.
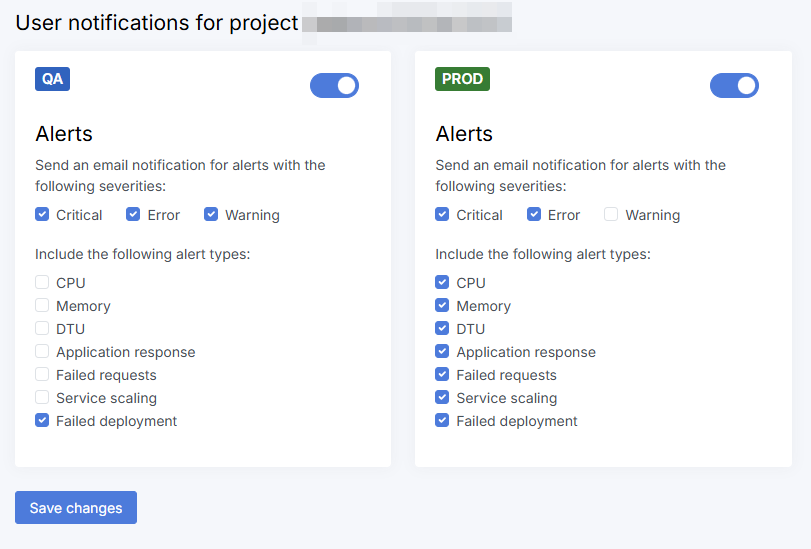
Alert email notifications
Whenever an alert is fired, the system sends a notification email to all Xperience Portal users assigned to the related project.
Individual users can adjust their preferences for receiving alert email notifications:
- In Xperience Portal, expand the top-right user menu.
- Select Notifications.
- Customize for which alert types and severities you want to receive email notifications from each deployment environment.
- Note: The selected alert severity and alert type conditions are combined using an AND statement. If you select Critical alert severity and CPU alert type, you will not receive any alerts of alert types other than CPU. For Production and Staging environments, it is recommended to enable all alert types and at least Critical and Error alert severity.
- Select Save changes.
Uptime monitoring
Uptime monitoring enables you to proactively monitor the uptime of your deployed applications. Each uptime checker periodically sends a request to its configured endpoint. When availability drops below the expected threshold, the system fires an alert and sends a notification email to all Xperience Portal users assigned to the project.
Use Uptime monitoring to track endpoint availability using custom uptime checkers. For platform or project outage incidents, see Outage monitoring.
Create an uptime checker
- In Xperience Portal, navigate to Monitoring → Uptime monitoring.
- Select Add uptime checker.
- Configure the following settings:
- Name – Enter a name (3–50 characters) for the uptime checker using lowercase letters, digits, and hyphens. Hyphens can be used as word separators but cannot be the leading or trailing character. Uptime checker names appear in alert notification emails, so use a descriptive name that helps your team identify which endpoint has failed.
- Environment – Select the deployment environment to monitor (QA, UAT, PROD, STG).
- Domain – Select the domain of your deployed application to monitor.
- Checked path – Enter the path to monitor (for example,
/admin/logon). The path starts with/and can be up to 100 characters. Each domain and path combination must be unique; you cannot create multiple uptime checkers for the same domain and path. - HTTP method – Select the HTTP method for the uptime check request.
- Expected status code – Enter the HTTP status code that indicates a successful response (for example, 200).
- Timeout – Set the maximum time (in seconds) to wait for a response. If the endpoint does not respond within this time, the uptime check is considered failed.
- Select Test connection to send a test request and verify that the uptime checker can reach the endpoint with the current configuration. This helps you identify configuration issues before saving.
- Select Create to save the uptime checker.
Manage uptime checkers
Navigate to Monitoring → Uptime monitoring to view existing uptime checkers. Use the Environment filter to display checkers for a specific deployment environment. To remove an uptime checker, select Delete () in the Actions column.