
Module: Understand emails in Xperience
12 of 36 Pages
Introduction to email statistics
When you send an email, your job isn’t finished once you click the Send button. Every message is a chance to build trust. Your contacts permitted you to reach their inbox, and treating their trust with respect is essential.
Email statistics help you see how your message performed: how many people received it, who opened it, and whether they clicked any links. You will see what’s working and what’s not, and improve your future messages.
Xperience collects statistics only for emails sent through a configured email channel. Draft emails aren’t tracked. That means you’ll see real data only after you publish and send an email to actual recipients.
Not seeing any stats? Here’s what to check:
- Ask your administrator to confirm that the email channel is correctly configured.
- Make sure the email sender address is valid and approved for sending.
- Check that your recipient list includes real contacts – not test addresses or users who have opted out of communication.
Remember: Email stats only appear when messages are sent to trackable contacts through a working email channel.
Analyze email performance in Xperience
Xperience provides a few places where you can check how your emails performed. These views help you understand delivery rates in statistics, your contact’s engagement through contact activities, and trends over time.
View stats for individual emails in the admin interface
To see statistics for a specific email, open the email channel you sent it from in the Xperience administration. Email channel is the technical foundation for sending emails. Depending on how your team sets them up, the channels will have business-friendly names. For example, the Kbank demo site has one Marketing Emails channel.
The number of available channels can also vary based on your project’s license.
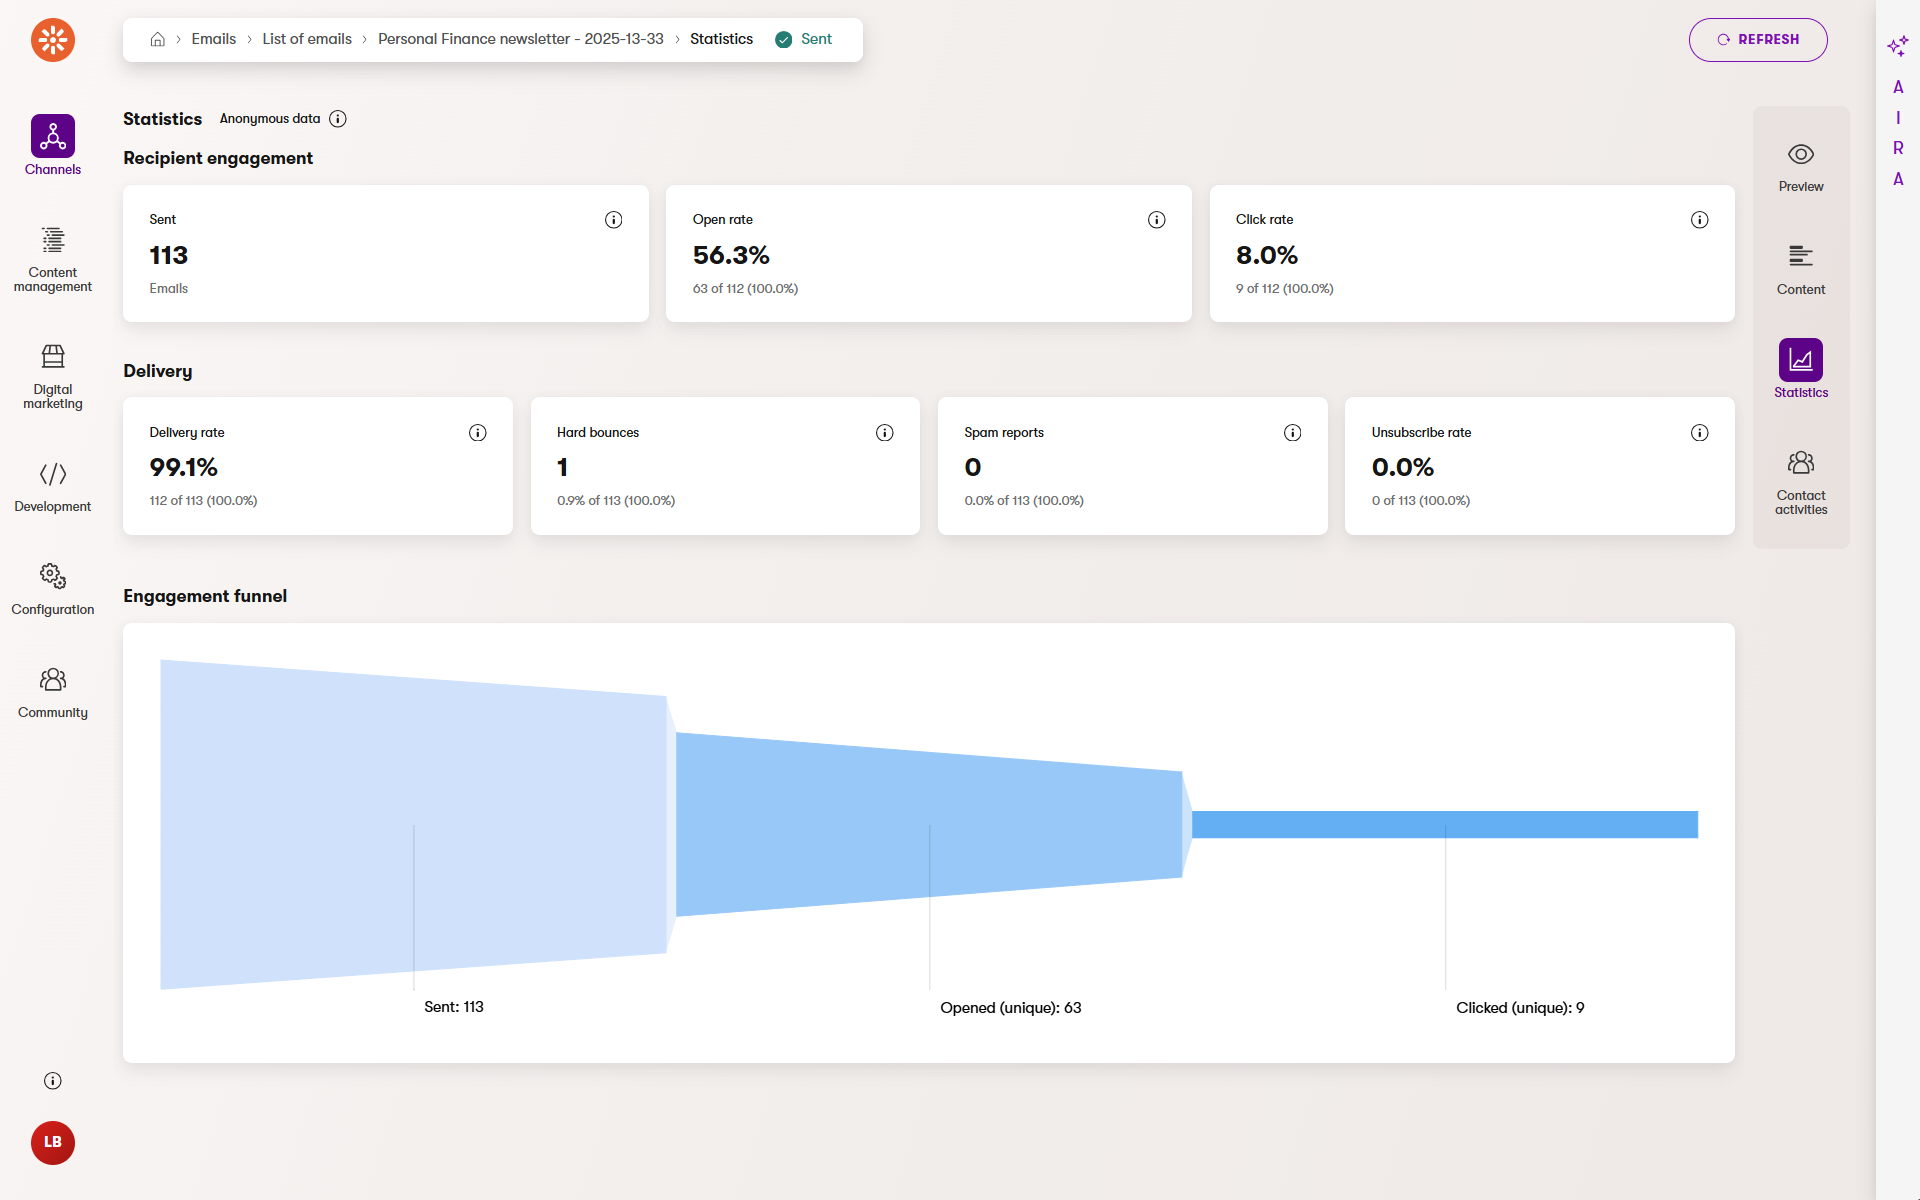
Choose your email and switch to the Statistics tab. You’ll find the most important metrics here, such as how many emails were sent, how many were opened, the overall delivery rate, how many clicks each email generated, and more.
Monitor overall email health in the Xperience Portal
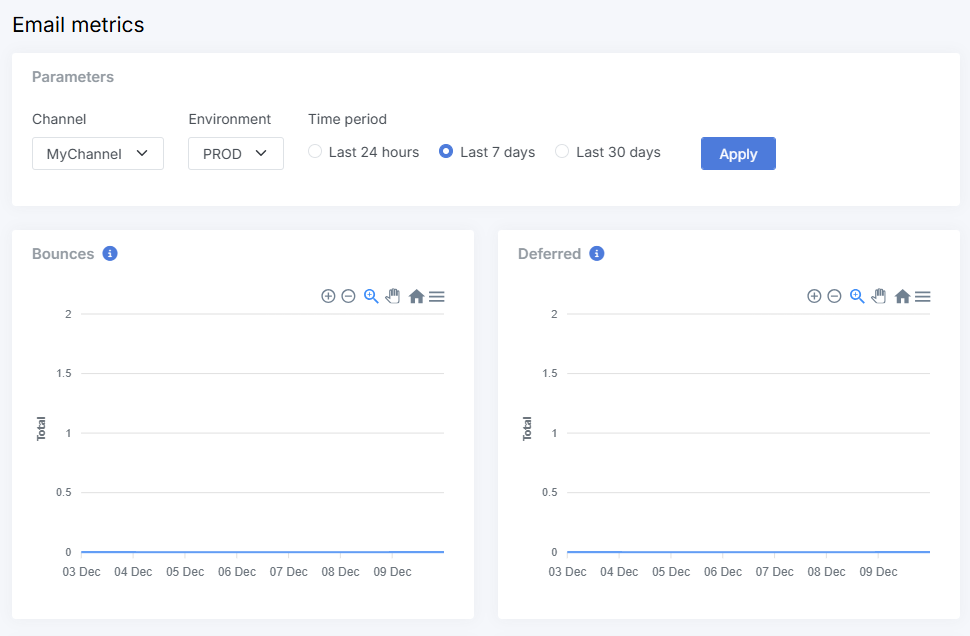
If you’re working on a SaaS project, you can also view email performance in the Email metrics application under the Monitoring section in the Xperience Portal. This view shows statistics collected directly from the SendGrid platform, which is Xperience’s built-in email delivery provider for SaaS.
Who can access the Email metrics app?
Access to the Email metrics application in the Portal is separate from access to the email channel in the Xperience administration. Usually, only users with access to the Xperience Portal, such as administrators, can view these SaaS-level statistics. If you don’t have access, ask your project admin to check your permissions.
You’ll see total counts for delivered, bounced, and deferred emails, along with the number of unique clicks. These metrics help you spot potential deliverability issues, understand how recipients interact with your emails, and find opportunities to improve campaign performance.
Comparing email performance?
Use the Statistics tab to review the results of individual emails, then check the Email metrics app in the Portal to spot delivery patterns and engagement trends across multiple sends.
Can’t find stats for an email? Double-check that:
- The email was sent through a configured email channel.
- You’re looking at the correct project environment in SaaS (usually called production).
- The email isn’t in Draft state or wasn’t sent as a test message.