
Module: Understand emails in Xperience
19 of 36 Pages
Track email interactions
Behind every customer journey is a data trail, and your email metrics are some of the clearest footprints. These numbers don’t just tell you how a campaign performed. They tell you how real people behave and what might help them take the next step.
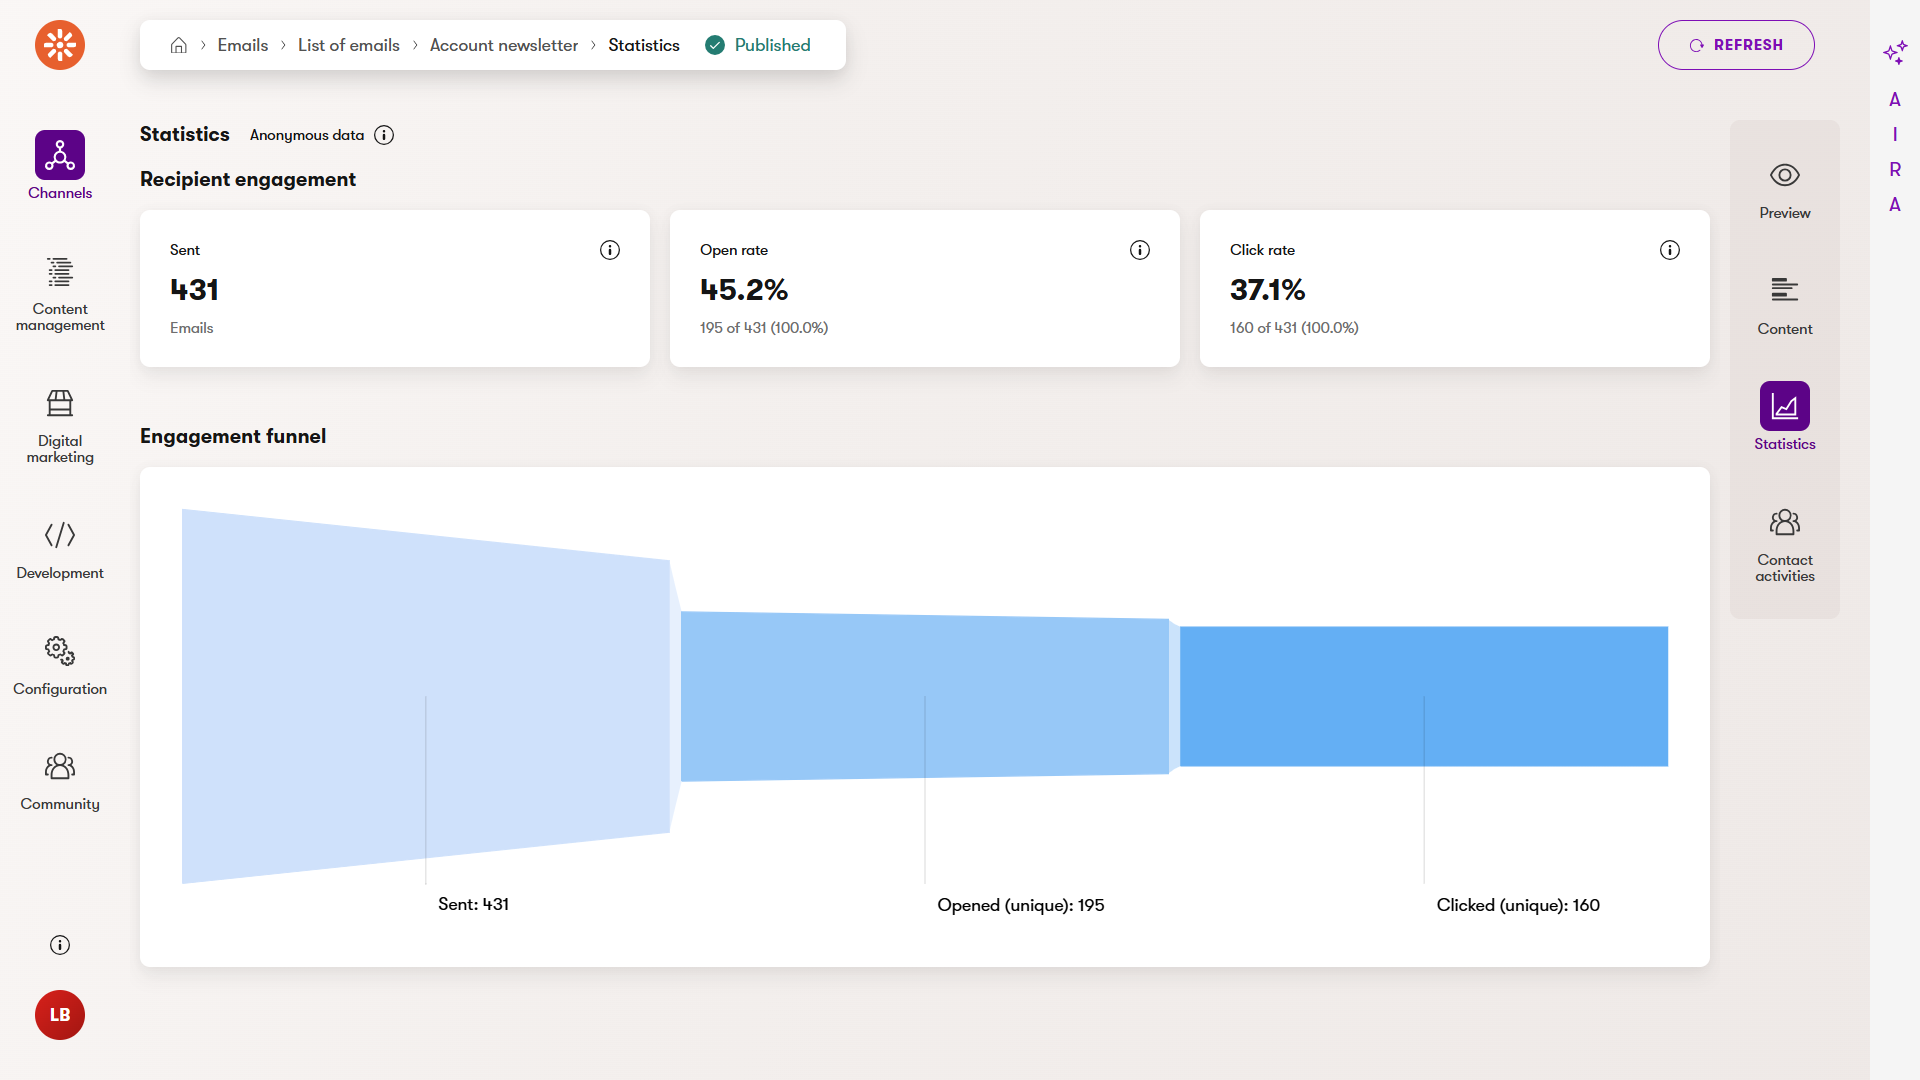
In Xperience, you can view these metrics in the Statistics section of every email created in the Marketing Emails channel app (or in the Email metrics app in the SaaS Portal).
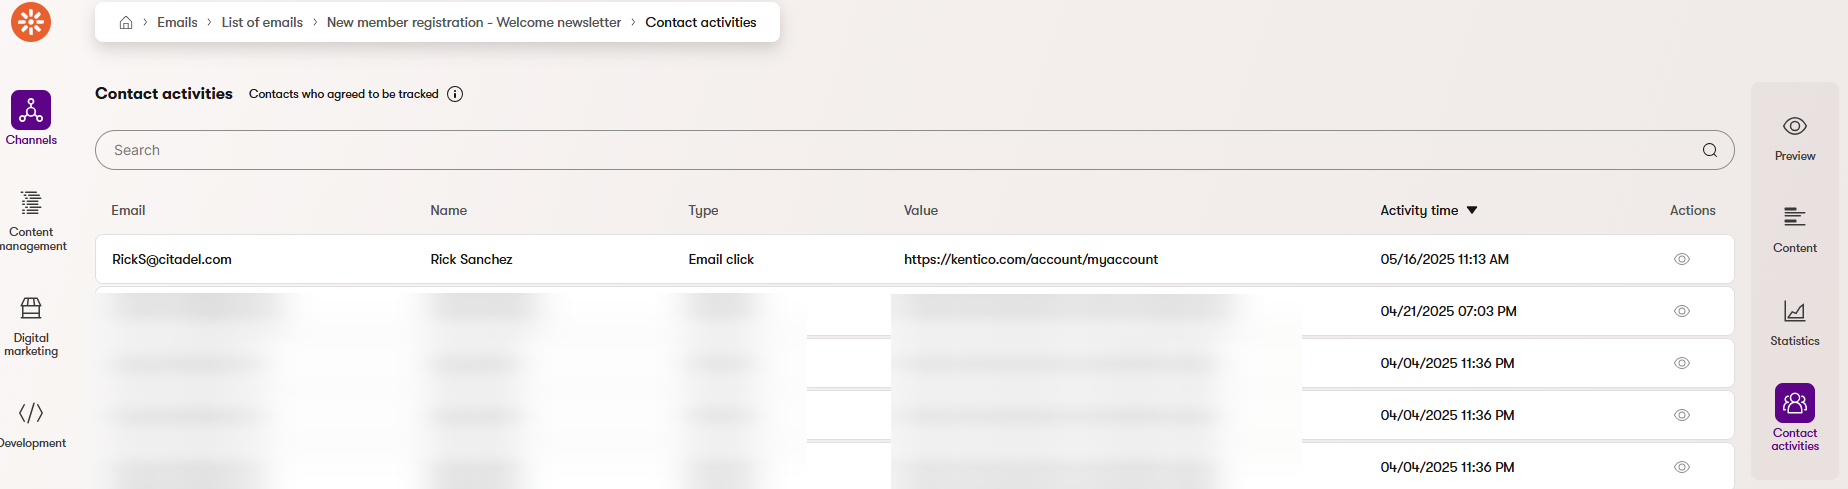
Want to explore the topic further? Use the Contact activities view to see exactly who clicked what and when. While it might be too detailed for high-level customer journey mapping, it’s still a great way to understand individual user behavior when needed.
To track statistics and activities for emails, the application must be properly configured. If statistics or activities are not logged for your emails, contact your project’s administrator or developers.
Xperience doesn’t track statistics and activities for draft emails
Here are the core metrics to watch and what they can tell you:
- Sent emails: The total number of emails your system attempted to send, including those that may have bounced.
- Impact: A high number here doesn’t always mean your message reached people, it’s just the starting point. Always pair this with delivery metrics to understand your real reach.
- Delivered emails: The number of emails that successfully landed in recipients’ inboxes (bounces excluded).
- Impact: This is your actual delivery footprint. A low delivery rate may signal poor list quality, outdated contacts, or domain issues affecting sender reputation.
- Opened emails: The number of recipients who opened your email.
- Impact: While it may be taken as a signal of interest, this metric can be very unreliable due to email client privacy features (especially on Apple devices). Don’t rely on it as a success indicator – rather use clicks for a clearer picture.
- Clicked links: The number of recipients who clicked at least one tracked link in the email.
- Impact: This is your most reliable engagement signal, especially when it comes to customer journeys. It reflects actual interaction and intent. Focus on this metric when building and adjusting your journey, and use it to trigger journey transitions, prioritize follow-ups, or segment contacts based on topic interest.
- Unsubscribed: How many recipients opted out of receiving future emails via your unsubscribe link?
- Impact: A small number is expected, but spikes may indicate content fatigue, poor targeting, or over-emailing. Watch closely after new nurture sequences or one-off promotional sends.
- Spam reports: How many recipients marked the email as spam in their inbox. (Available when using SendGrid. Developers can also implement custom support for displaying complaints from other email providers, as long as those providers include this information in their reporting.)
- Impact: Spam reports harm sender reputation and can affect future deliverability. More than a few per campaign should prompt an urgent review of subject lines, content tone, frequency, and list quality.
By tracking these metrics regularly, you gain more than performance insights. You gain early warning signs and improvement opportunities. When used as part of a customer journey, they become practical tools to shape your campaigns’ timing, messaging, and direction.
All engagement data depends on tracking consent. Contacts without consent may not appear in journey stats, even if they received your emails.